 by Dec 20, 2017
There’s knowing that a problem exists and then there’s knowing what it is and what to do about it.
They are two very different issues, and network engineers have been grappling with them for a long time. While there is no shortage of monitoring tools on the market that can alert engineers to an anomaly or potential network problem, what happens after the issue has been detected is normally a lot less clear and is where NetBrain excels.
NetBrain has extremely powerful monitoring capabilities of its own, but it is not designed to replace existing 24×7 monitoring solutions. NetBrain’s capabilities are instead concentrated on diagnostics in response to an event, to help visualize the problem area and understand how to fix it. As such, NetBrain customers typically see the most value by integrating NetBrain with their existing network monitoring solutions.
In most situations following an alert, network teams perform manual data collection and analysis through the command line interface (CLI). And we all know that manual data collection is slow and tedious and that its accuracy level can vary greatly. It also delays critical reaction time that can lead to more serious problems down the road.
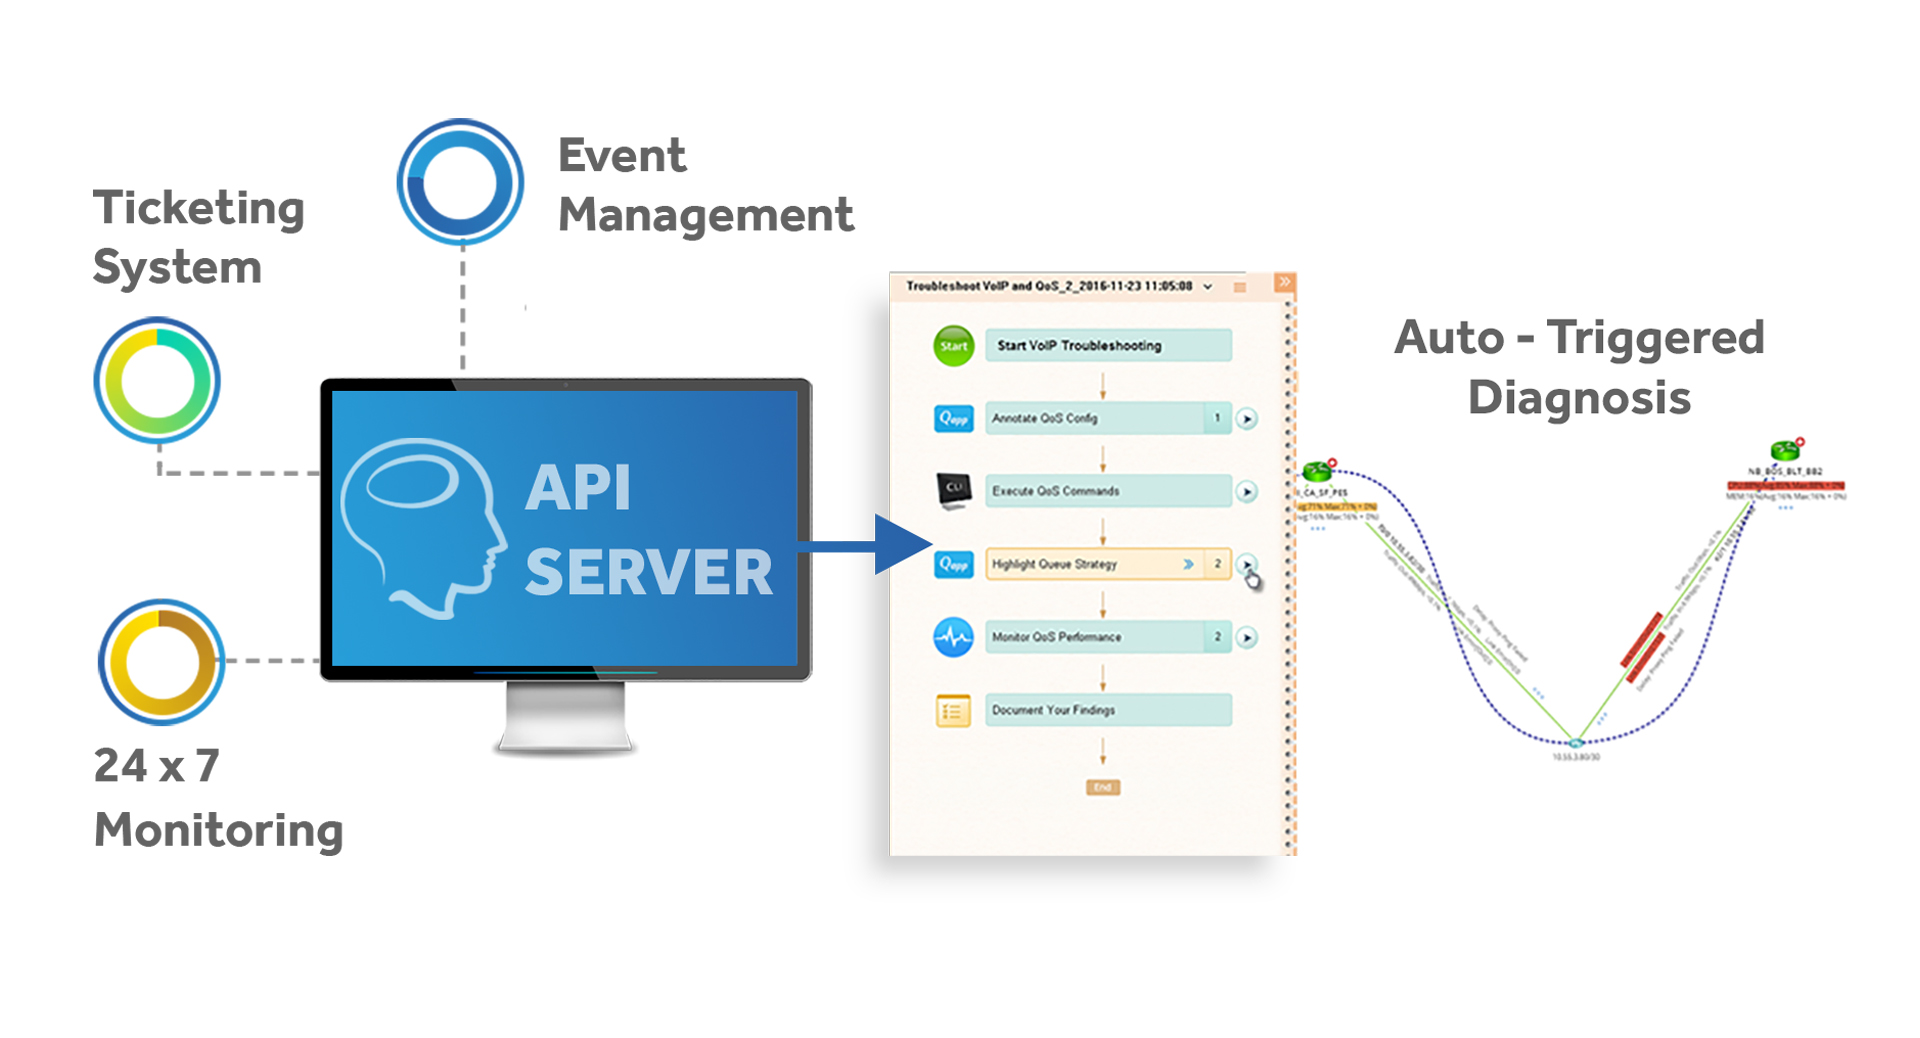
Instead, NetBrain can be integrated with existing monitoring solutions via RESTful API to trigger an alert at the instant an event is detected. This provides real-time visibility and diagnostics from the moment the event occurred. This data visualization informs network teams how to respond quickly, saving critical time otherwise spent collecting and analyzing data.
Rather than responding to alerts from their monitoring solutions minutes or, more likely, hours after the event occurred (which is typical of most organizations), NetBrain provides engineers instant access to a Dynamic Network Map of the problem area and runbook data providing actionable insights, which are particularly valuable for intermittent issues. The ability to overlay all the monitoring results onto a Dynamic Map allows you to contextualize a problem area on the network at the device and interface level. For this reason, dynamic maps far exceed using a static network diagram.
NetBrain’s diagnostic monitoring is also much deeper than traditional SNMP-based monitoring solutions. NetBrain leverages telnet/SSH in addition to SNMP to provide advanced analytics such as interface errors, QoS queue drops, route flapping, and more. These diagnostics are fully customizable, leveraging NetBrain’s visual programming environment (no scripts required).
Knowing that you have a problem on your network is a good start. Having the tools to understand where the problem lies, its potential for damage and how to eradicate it quickly is even better.
Discover how NetBrain can be a force multiplier for whatever monitoring solution you have in place.
Schedule a personalized 30-minute 1-on-1 demo with one of our experts to see NetBrain in action here.