Map & Design
Auto-Discovery
NetBrain auto-discovers your entire live hybrid network, including traditional components, software-defined LAN and WAN, and cloud, making all its information about configuration, performance, and flow of traffic easily accessible to any operator or engineer as part of our visual management and automation console.
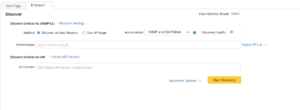
NetBrain’s discovery engine continuously inventories all devices, their configurations, the connectivity, and the protocols, including IPv6 addresses. The result is an exact “digital twin” of the end-to-end network in real-time—every device, every platform, every firmware version – which contains all the topology data and baseline configuration, and performance analysis. It then provides this information in an easy-to-navigate and intuitive visual management console.
NetBrain allows easy identification of historical trends and changes. It runs a benchmark task after the discovery of the hybrid network. The digital twin dynamic data model enables NetBrain to interact with the infrastructure as needed, interactively, or by applying automated tasks.
Live Digital Twin
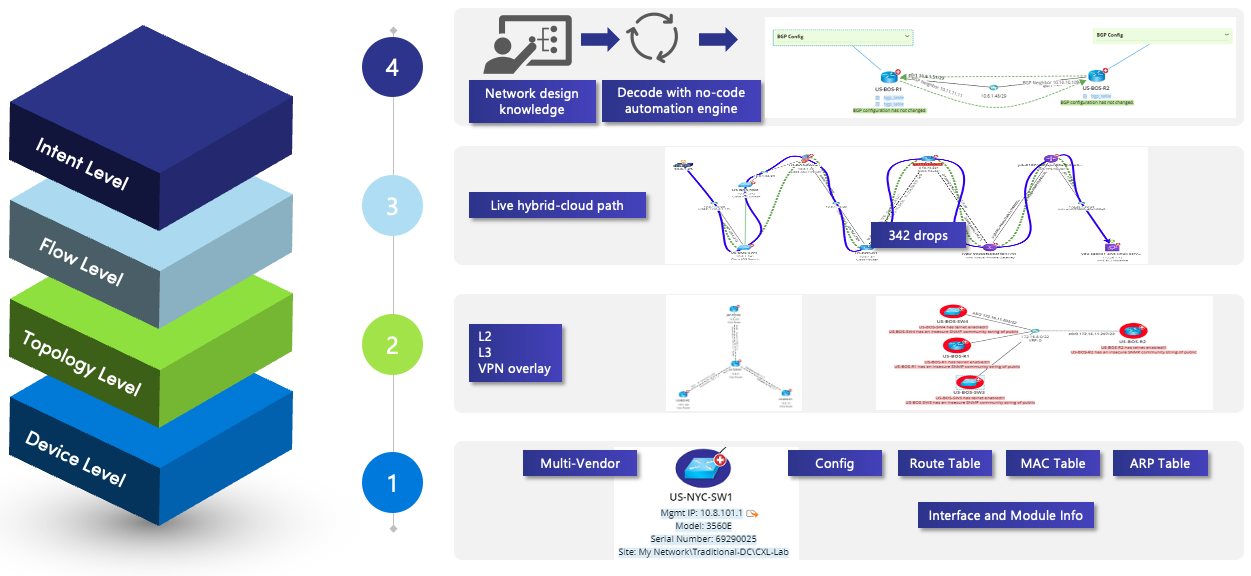
NetBrain builds a live mathematical data model to represent any hybrid network, which is constantly being updated by recursive new data collected via daily scheduled benchmarking. The NetBrain digital twin is the most advanced model available throughout the industry as it includes:
- real-time device-level (i.e., inventory, configuration, memory, and CPU utilization),
- the topology detail of how devices are connected (including data-center, software-defined, and cloud-based) as well as
- a complete understanding of the flow of traffic (e.g., as reported in real-time from the devices themselves) and
- the desired behaviors or Network Intents (discussed throughout the remainder of this document). Critically, the digital twin captures inherent network ‘intents’ in the network. From network designs, golden configs, and troubleshooting best practices, intents are captured through NetBrain’s no-code automation platform.
Dynamic Map
Model-Driven Map
NetBrain redefined the concept of network mapping by offering the industry’s only real-time network Dynamic Maps which continuously discover, model, and visualize the entire hybrid network – from the public cloud all the way down to the network edge. And because the data model also includes the ability to do historical data comparisons, it’s easier to identify changes and potential sources of problems. Operations teams can now use network mapping software to visualize, navigate, investigate and troubleshoot hybrid network issues in a single consolidated view (including data programmatically collected from third-party monitoring applications) to display:
Network inventory physical configurations:
- Network logical topologies (L2, L3, MPLS, IPSEC, SDN)
- Network design pathways
- Network baseline configuration and changes made over time
- Contextual Data received from 3rd-party tools (via API)
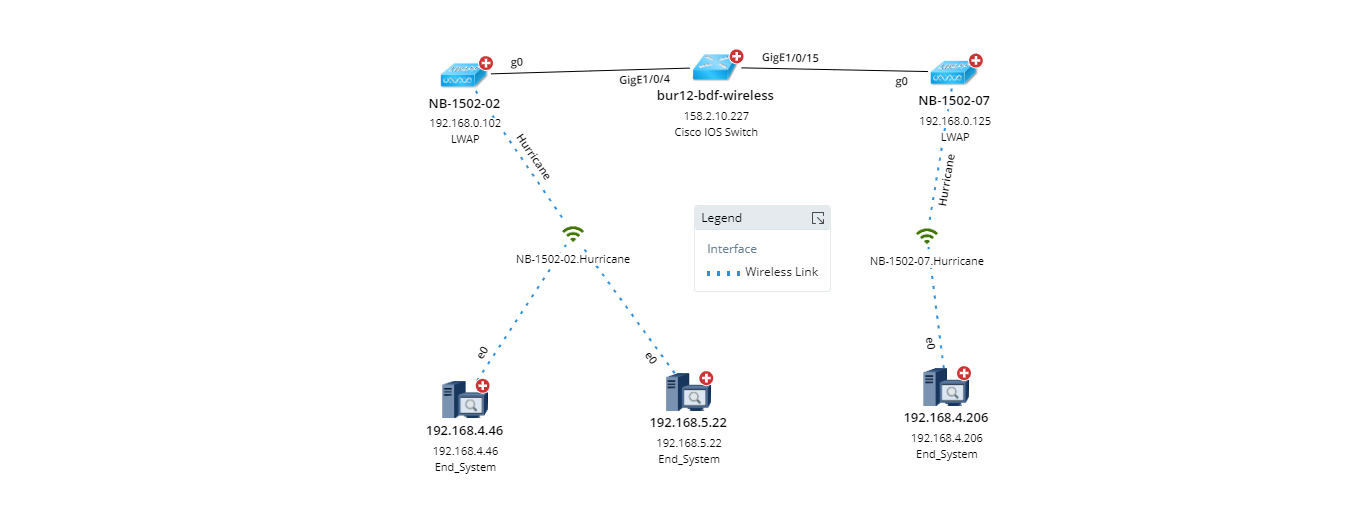
Unlike static diagrams, high-level Dynamic Maps are rendered on-demand based on actual live data for every point(s) in the network in a single pane of glass. NetBrain’s digital twin and the associated Dynamic Maps solution provide the perfect foundation for NetBrain’s network automation capabilities.
-
- Figure: Live map showing Layer 2 wireless links
-
- Figure: On-demand map of OTV VXLAN topology, showing overlay of virtual links
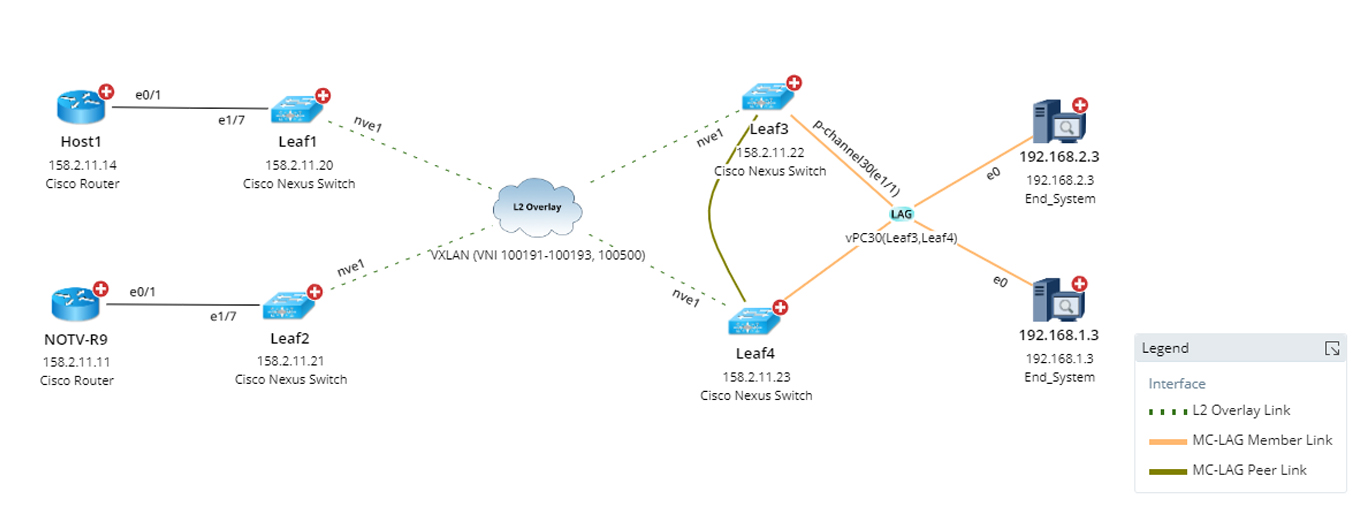
-
- Figure: Real-Time map of datacenter showing layer 2 & 3 topology

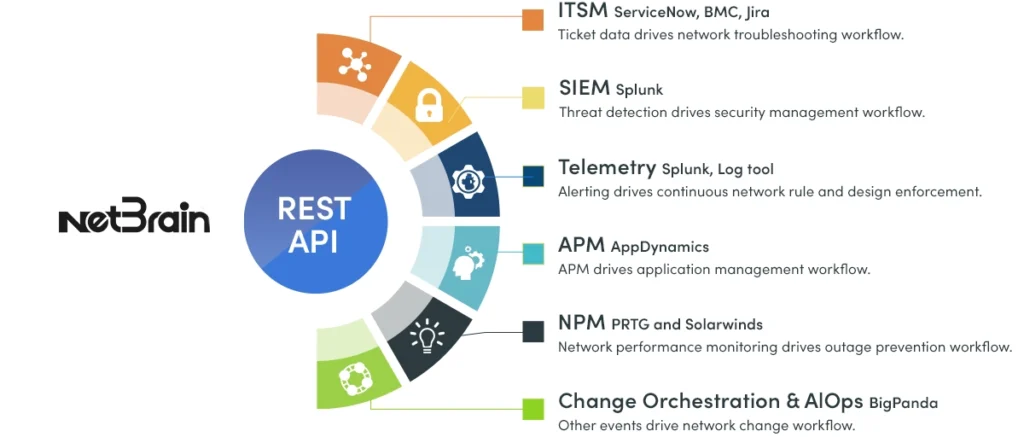
API Integration with 3rd-Party Systems with Data View Templates (DVT)
Data View Templates provide the capability to visualize various network information and drill-down actions on a map to help network engineers in interactive troubleshooting scenarios.
Network Mapping – Spanning-tree information from the devices
Variable-based golden baseline and historical data provide the power engineers need to understand the overall status of the data historically. Using NetBrain’s no-code approach, the intuitive UI and associated Visual Parser allow end-users to easily define the Data View Templates.
Organize drill-down actions by various automation tools, like Network Intent, Runbook Template, CLI, Compare, etc. Engineers can leverage drill-down automation actions to perform further diagnoses.
Application visibility across the hybrid network visualizes all network data powered by the Intent Data View and Data View Templates (to power 3rd-party data integrations).
Data View Template with PRTG data
Search Dynamic Maps
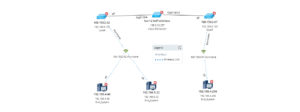
NetBrain’s Dynamic Maps become the foundation to visually interact with the network. For any desired task or investigation, NetBrain will create a real-time and intuitive contextualized map of the relevant part of the network.
The search bar in NetBrain acts like a Google search for any data within your network. Search leverages the power of big data network mapping by quickly finding and visualizing relevant network information. Entering a free text string into the bar will run a search across the entire data model for matching any data element, and you can combine it with a description to narrow your search even more. For instance, you might be looking for a “CISCO” router running IOS version “15.5” and located in “Atlanta.”
Once the search identifies the device in question, it creates a map of the device and its immediate neighbors, which can also be expanded or contracted depending on the view desired and the problem being addressed.
Search for any network device, map it, then add neighbors
Generate a Site Map
As part of automatic network mapping, sometimes you will need complete documentation for an entire existing site or branch office. Since NetBrain maintains a real-time digital twin of the entire network throughout the network mapping process, it can create these needed maps at the touch of a button to be used elsewhere for remedial, operations or compliance purposes. And since NetBrain’s visual network mapper also includes geographic and organizational attributes, it helps your teams focus on the network topology in terms most familiar to their operational processes.
The logical relationships between sites can be grouped for analysis and then visualized in a single overview map (e.g., North America, United States, Boston, Boston DC 1). Users can then take advantage of specific functions within NetBrain’s network mapping tool to drill into any site to see the L2 or L3 relationships of devices within that site.
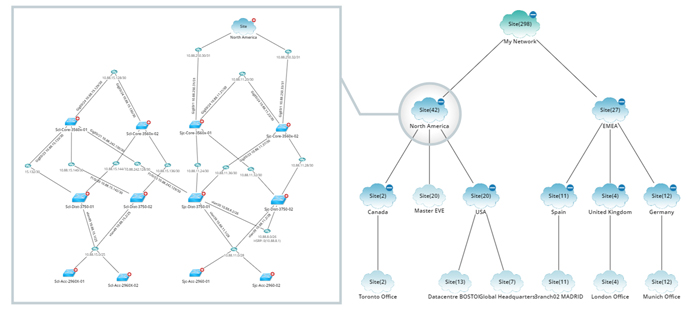
View a hierarchical map of all network sites and a topological map of a specific site, North America.
Device Group
A Device Group is a collection of devices configured with the same routing protocol or categorized by other logical conditions. Device groups can better organize network devices, critically important for operations at scale. These are the types of device groups:
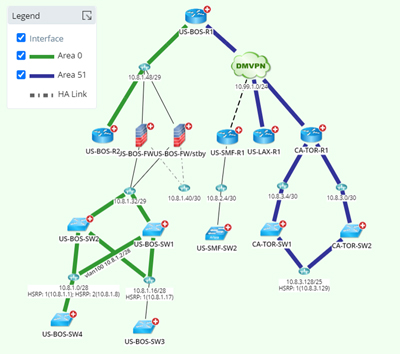
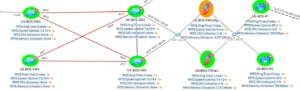
Visualize OSPF design for a group of devices
- My Device Groups — contains private device groups that are only accessible to you. To set a private device group as public.
- Public — contains device groups that can be made accessible to all users in the current domain.
- System — contains the system’s built-in device groups generated after the routing protocol calculation for the discovered devices. Every system device group collects devices configured with the same routing protocol and AS number and is also named with the routing protocol and the AS number, such as #EIGRP 100. The device groups in this category are not intended to be modified or deleted.
- Media — contains the media used to connect interfaces of multiple devices (multi-point) together in a specific topology type, including LAN, WAN, DMVPN, MPLS Cloud, bus, etc. For example, a LAN segment in IPv4 L3 topology.
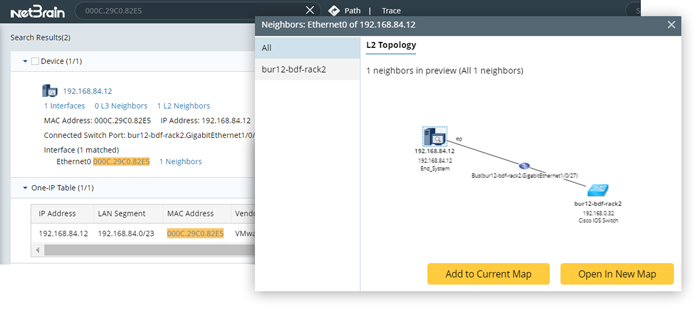
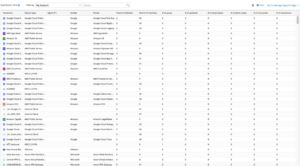
One-IP Table
IP Address Management, or IPAM, provides precise information on the state of the network and the IP addresses being used at a given time.
IPAM has become a critically important part of quickly analyzing and troubleshooting any network and providing a better understanding of its performance.
NetBrain’s One-IP table records the physical connections for all IP addresses in the workspace. It is retrieved using the network map software during the Layer 2 topology discovery, and it can be used to troubleshoot any Layer 2 connection issues. Once opened, it will automatically group IPs by LAN segments.
Given this table, navigation can be as simple as searching for a unique address and then dragging it to the map to create a visual table of the device and its network neighbors. In addition, using network infrastructure mapping, you can export any One-IP table to applications like Microsoft Word or Excel as needed.
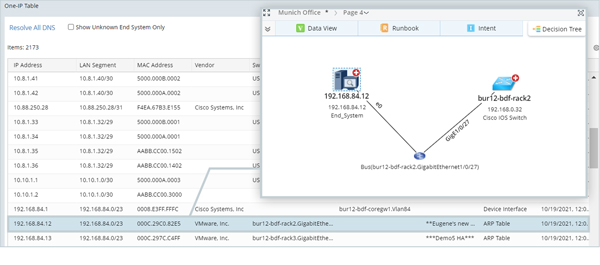
Troubleshoot any layer 2 connectivity issues
Export Map to Visio Diagram
Users can also save their existing Dynamic Map view(s) and export it into native and editable Microsoft Visio with the click of a button. The amount of detail on the map at the time of the export is reflected in the resulting file.
Export any map to Visio for easy documentation
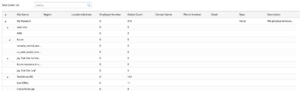
Inventory Report
Use pre-built reports as templates for exporting or personalizing your inventory reports. Customize them according to device scope and asset data preferences.
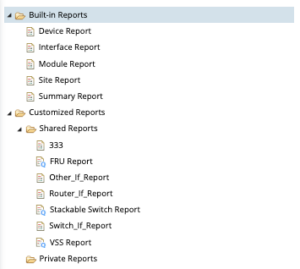
Site Report
Summary Report
Export Map to Microsoft Word
Users can save their maps and export them directly to a formatted reference document including all associated design and inventory data with the automatic network map including diagnostic data, full configuration files, routing tables, etc.
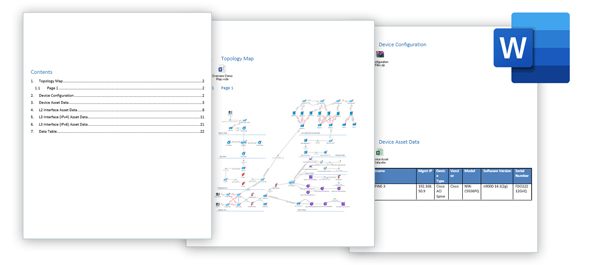
Export maps, config files, and inventory to Word for documentation and reference
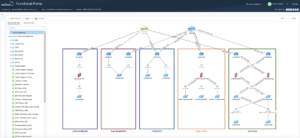
Functional Portal – A Collaborative Visual Management Portal
NetBrain’s Function Portal enables network engineers and operators to collaborate with their colleagues and others in related support organizations (SecOps, DevOps, etc.) who do not normally use the NetBrain system, but who are critical for expeditious cross-domain problem resolution. Real-time collaboration reduces the number of hand-offs and associated delays typically seen with manual processes.
Improving team productivity and collaboration through accessibility is one of the key goals of MAP EVERYWHERE. With Function Portal, external users from different teams (IT engineers, security engineers, etc.) can gain fast and free access to use selected NetBrain functions and resources through a website, including dynamic network mapping, A/B path calculation, and One-IP table query.
Application Pathing

NetBrain allows users to visualize, analyze and interact with dynamic traffic paths across complex hybrid-cloud networks, taking into account:
- Dynamic and static routing specifications
- Network Address Translation (NAT)
- Both L3 and L2 traffic flows
Get a historical view of traffic paths and visually compare traffic flow patterns over time.
Dynamic Path
Visualize packet forwarding and emulate real-packet forwarding by looking up route tables in your live network for end-to-end visibility across any network path.
Investigate PBR, NAT, ACL, firewall policies, and other traffic control technologies to ensure path accuracy. It understands that forward and reverse paths may differ because its visualization data model relies on the actual device tables between the two points.
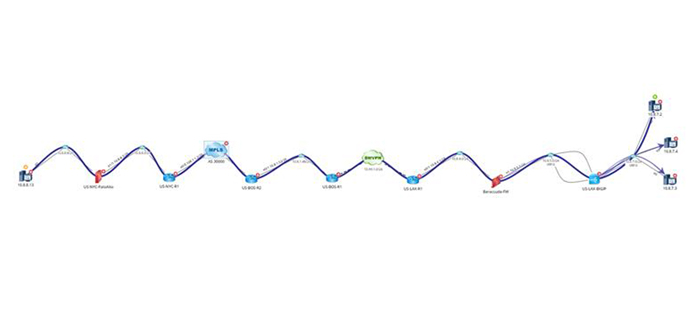
-
- Path across Multiple Vendors and Technologies: Palo Alto, Cisco, F5, Barracuda, MPLS, DMVPN
-

- Path across NAT
-
- Path across QoS and Policy-Based Routing (PBR)

-
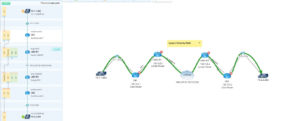
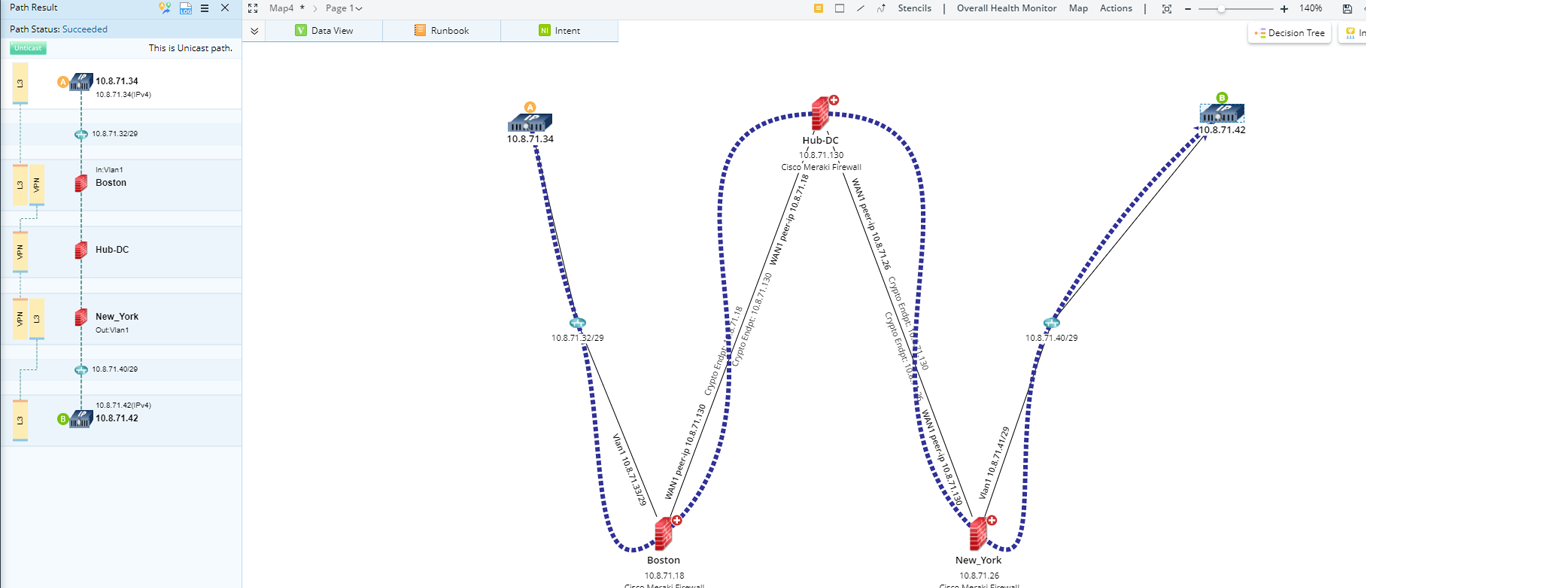
- Path across Primary and Secondary (HA) Firewalls

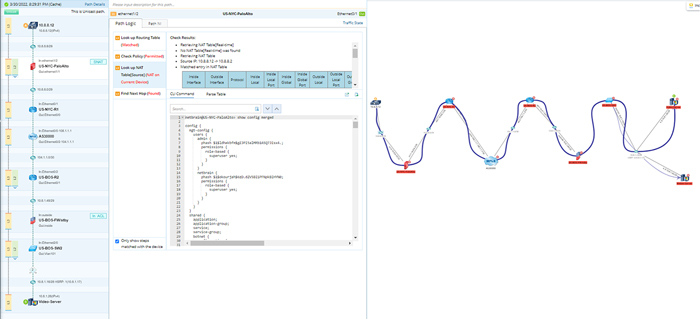
A to B Path Across a Traditional Network
Support for hardware device control plane logic for >300 vendors and over 5,000 of their hardware models, interfaces, and firmware versions. Given this native access, it can calculate any A/B path end-to-end, across complex technology including:
- Live A-B Path Discovery – Retrieves the routing table from the live network and presents both forward and reverse paths.
- Historical A-B Golden Path Calculation – for determining what the “normal” network path looks like (e.g., for a given application) and how it may have changed over time
- Mapping A-B Application Paths – A hybrid L2/L3 map of the traffic flow is automatically calculated and drawn, in real-time. Path logic assesses the traffic-forwarding characteristics of all the devices involved including the routers, switches, firewalls, load balancers, and more. The enhanced path framework automatically calculates based on the topology dependency of the outbound interface at each hop and calculates path types such as L2, L3, IPsec VPN, VPLS, OTV, or VXLAN. Use this to isolate the critical network components when investigating network or application problems, as part of design review projects, or to proactively assure application availability.
-
- Layer 2 VPLS overlay

-
- Source to destination path across SDN/ SD-WAN
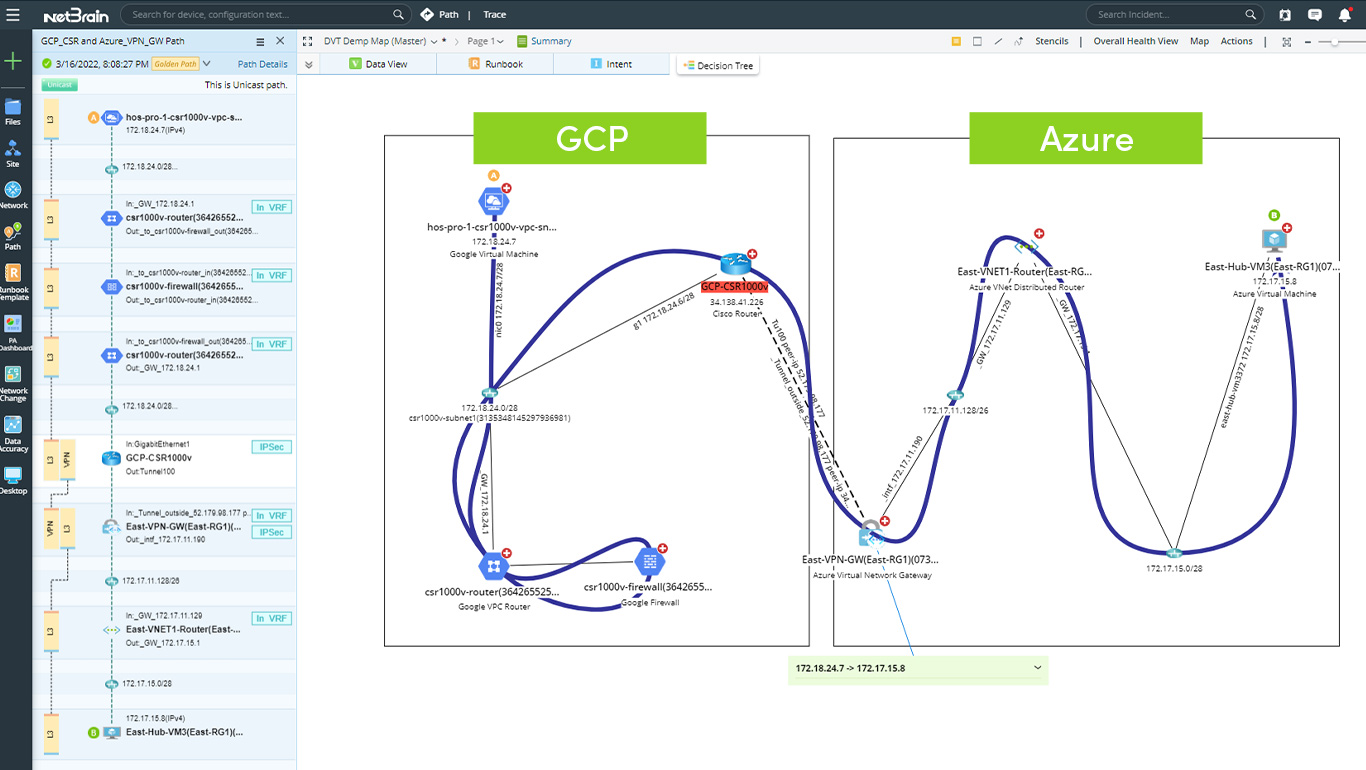
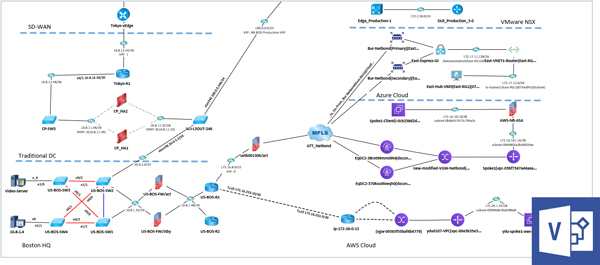
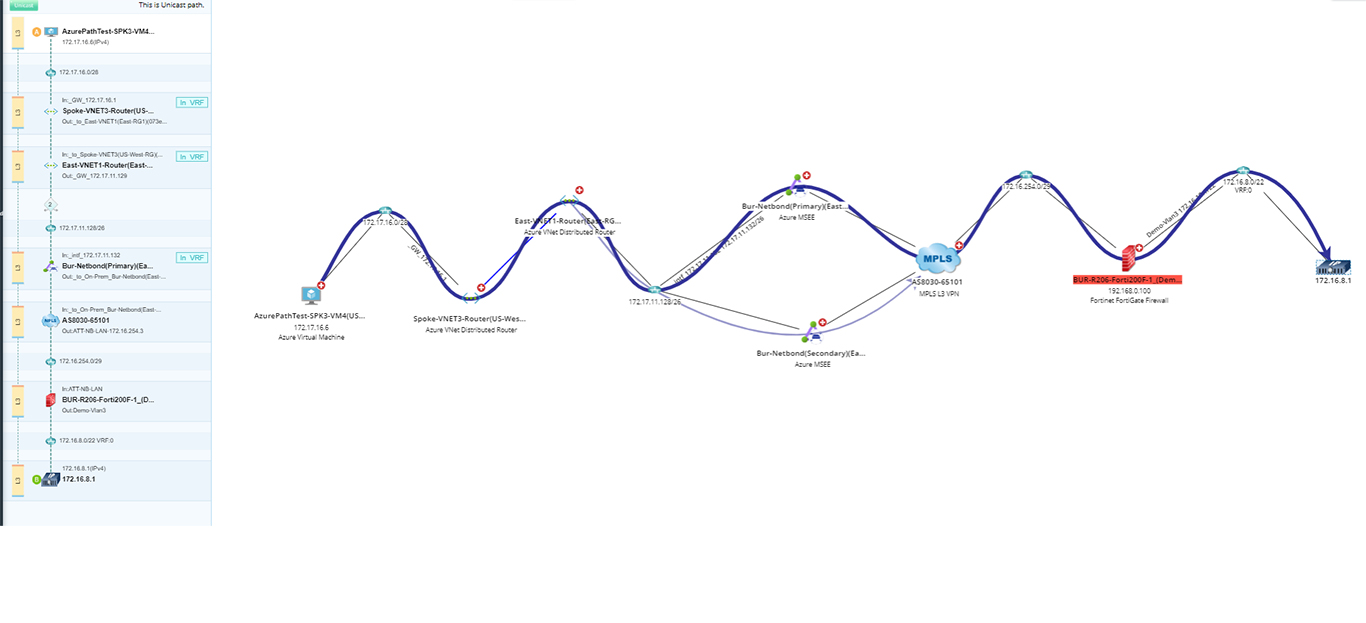
A to B Path Across Public Clouds
While many organizations treat cloud-based services as black boxes, NetBrain offers complete native network support for all the major public cloud providers.
This enables true end-to-end path calculation in a hybrid/multi-cloud environment- even if both ends are in the public cloud!
Your network automation, visibility, and control no longer stop at the cloud.
-
- End-to-End visibility across AWS cloud infrastructure
-
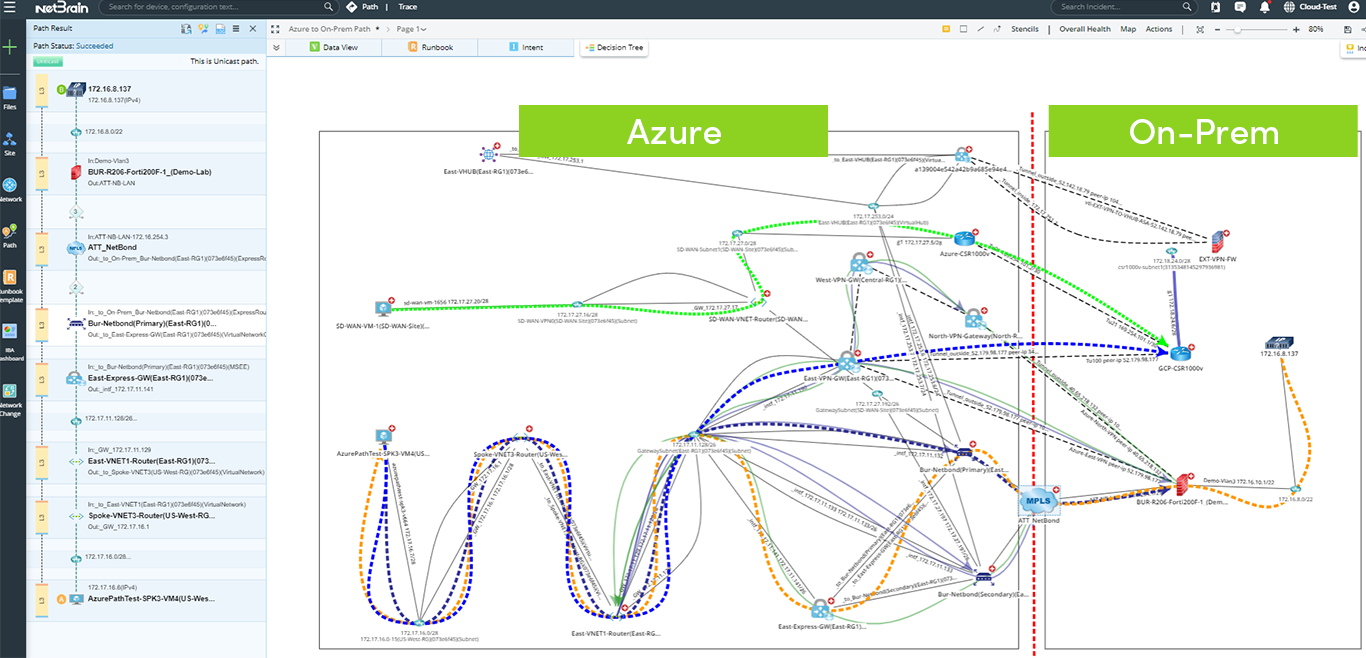
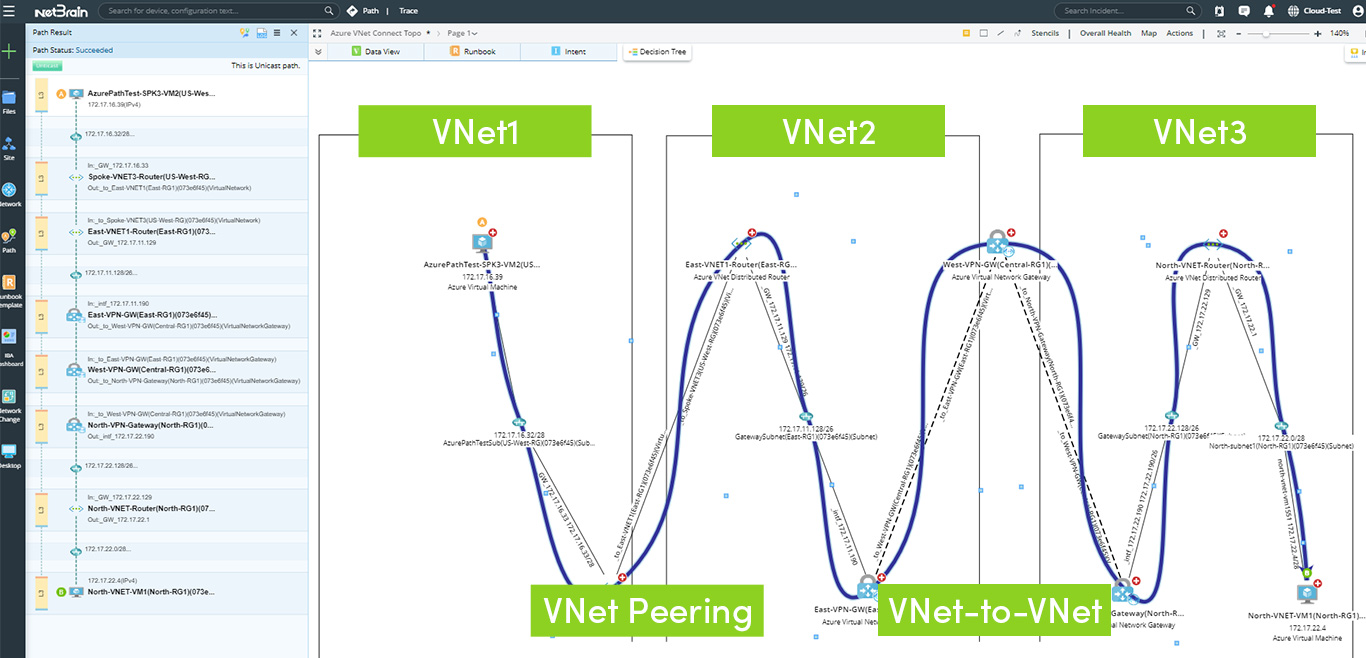
- End-to-End visibility across Azure cloud infrastructure
-
- Visibility across entire Hybrid network: AWS, IPsec VPN overlay, direct connect underlay

-

- End-to-End visibility across Google cloud infrastructure
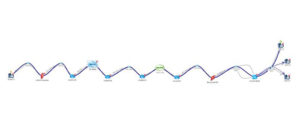
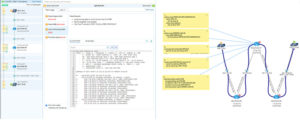
History, Live, and Reference Path
NetBrain doesn’t generalize device-type modeling but instead has direct support for the control plane logic of more than 5,000 devices from over 300 vendors. With this native control plane access, any A/B path can be calculated end-to-end, across any complex technology including:
- Live A/B Path Discovery
- Historical A/B Path Reference
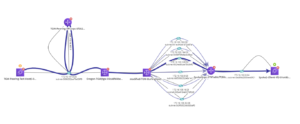
- Golden Path Calculation – for determining what the “normal” network path looks like (e.g. for a given application) and what may have changed over time.

Last week’s traffic path went through MPLS cloud (historical path)
Multicast Path
Compared with a unicast path, various calculation logics are available for a multicast path. The system adds a “Multicast Route Table” and uses it to look up L3 next-hop devices during a path calculation.
Note: For the first-hop device, the system looks up its next-hop device based on the original routing table. When checking ACL/Policy on interfaces, the system checks whether the group IP as a destination is matched and continues path calculation based on the matching result.

Path calculation logic for Multicast paths
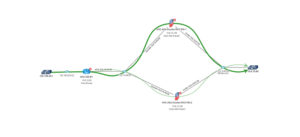
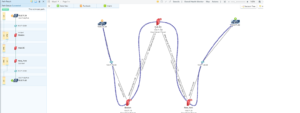
The Path at Port Level
The path at the port level can be used to calculate the paths for TCP, UDP, or other protocols. As shown below, the TCP traffic to the F5 load balancer’s port 80 is load balanced to 3 different endpoint servers.

F5 load-balanced path to 3 End Servers, on TCP port 80
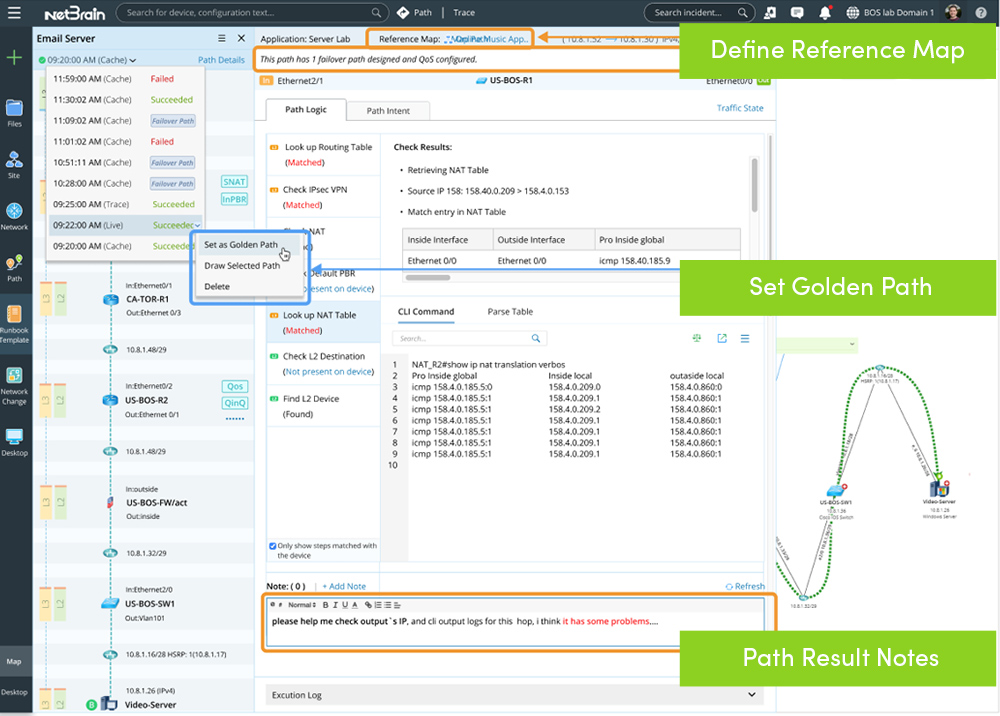
Troubleshooting Paths
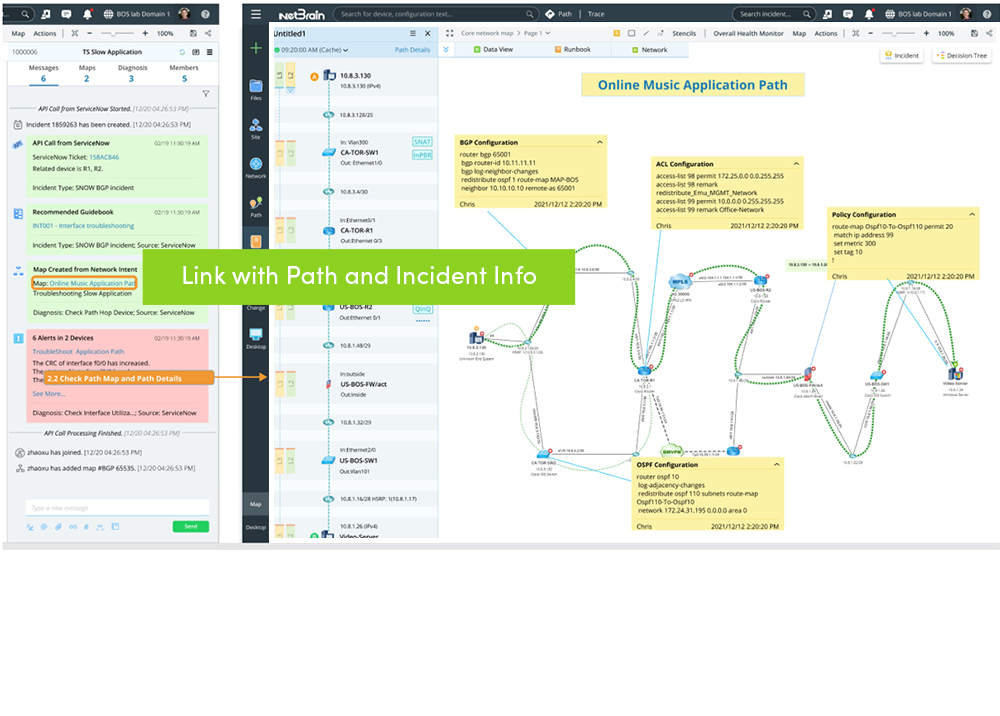
Path Intent and Trigger Automation Framework (TAF) and other Path related function enhancements, enable users to baseline, document, and define the diagnosis logic for application paths efficiently when the network is healthy to help network engineers resolve application slowness issues much more efficiently during troubleshooting or to do application impact analysis efficiently when issues occur on a network device or device interface.

Baseline Path and Path Intent
Add Path Intent into Intent Cluster (when the network is healthy) – When the network is healthy, calculate critical application flows for live network data with full documentation behind the path logic, and programmatically define logic for path-related baseline data and diagnosis logic inside the Path Intent without coding.
Add predefined Path Intents into a NIC as static member intents. You can define trigger diagnosis using the NIC and define the NIC filter condition with path source/destination properly.
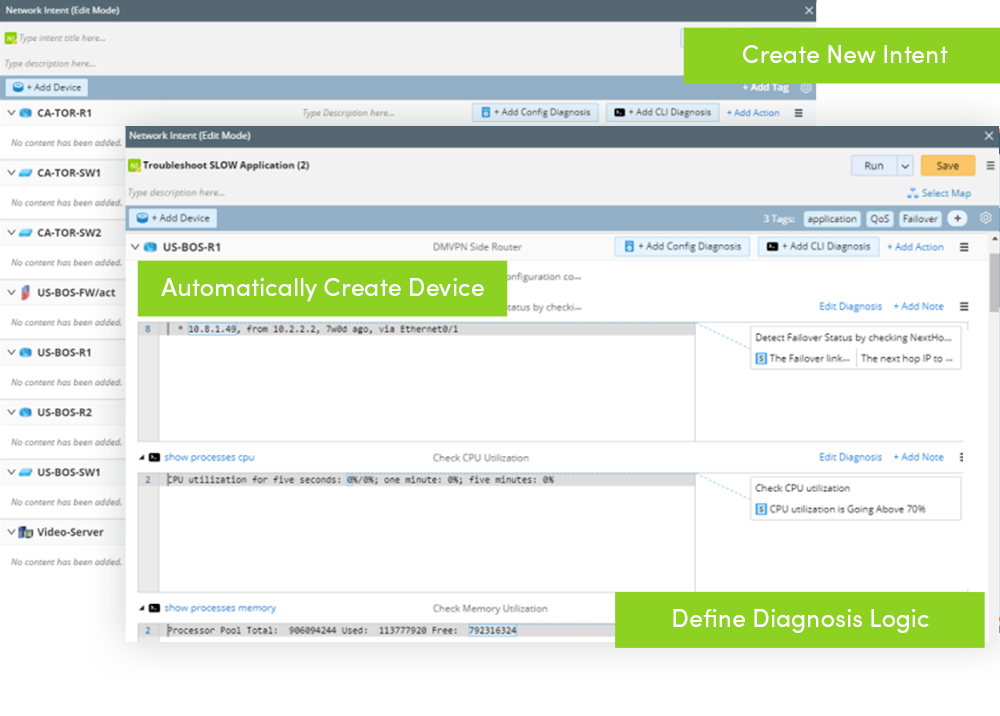
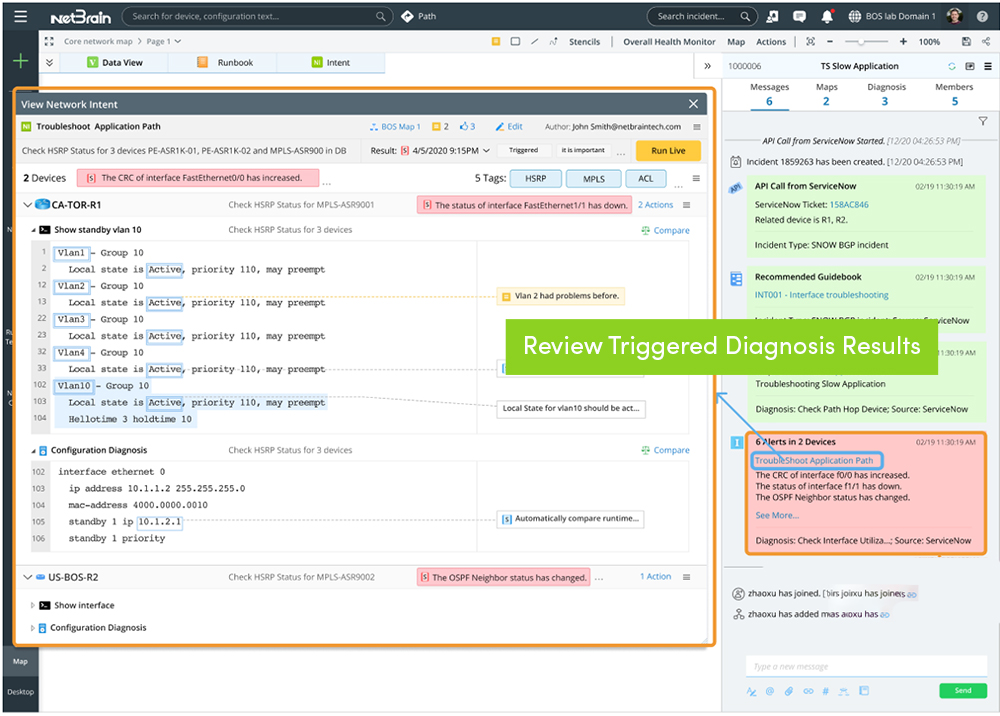
Trigger Path-Based Diagnosis
NetBrain receives a ticket from a third-party ITSM and triggers the execution of Network Intent according to the defined logic. Intents execute on their associated member NIs. Path NI executes and then sends an alert to the Incident Pane.
Review Baseline Path and Path Intent
During troubleshooting, access the pre-documented application path intuitively via the A/B path dialog. The pre-documented path results along with the pre-built diagnosis automation accelerate application troubleshooting.
Calculate Live Path and Compare with Cached Path
During troubleshooting, re-calculate live paths, and compare paths between live and cached data to reveal various issues behind a slow application.

Execute Path Intent and Diagnose Issues
Re-calculate an associated path via a live network, then the user can check the Intent diagnosis results directly.


SDN Visibility
Cisco ACI
Demand for robust data center networks continues to increase as organizations struggle to achieve business agility for application deployments. This has led to the growing adoption of Software Defined Network (SDN) solutions as part of a data center architecture evolution. Cisco’s Application Centric Infrastructure (ACI) and those from VMware are the industry’s most popular solutions to address these demands.
Network teams must now understand this new architecture and manage it effectively, along with the rest of the traditional network it connects to. Without effective tooling support, the task of managing such an evolving heterogeneous network has proven to be very challenging. NetBrain’s Dynamic Mapping and automation technologies help network teams demystify the complexity of a virtualized infrastructure, allowing them to realize the full benefits of SDN without the operational challenges. NetBrain treats these logical network connections, although virtualized and software-defined, as just another part of the topology. This continues to support true end-to-end visibility and automation for infrastructures that include these logical approaches to connectivity.
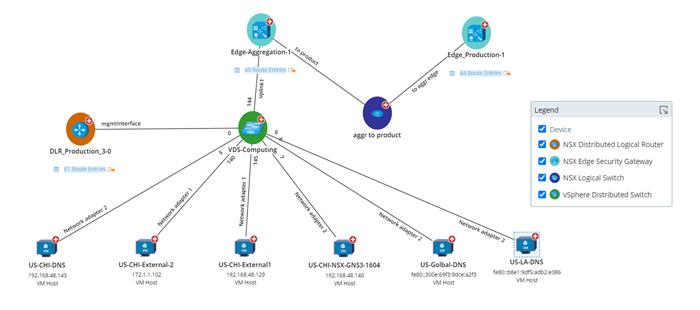
VMware NSX
NetBrain’s deep discovery and modeling engine don’t stop when it gets to VMware-powered NSX environments. NetBrain treats NSX as any other network and creates a data model that serves as the foundation for automation, analytics, and workflow enhancement for operational IT Tasks. NetBrain makes it possible to quickly understand and support the deployed NSX infrastructure in the following aspects:
- Map the logical NSX connectivity alongside the traditional physical network – obtain accurate and up-to-date visibility into the NSX environment, along with the external network it is built upon.
- Visualize data from multiple sources on a map.
- Turn on and off layers of physical and logical information with Data View, including data from 3rd party IT management solutions.
- Understand the mapping between virtual and physical components.
- NetBrain can help you abstract and maintain clear visibility of the virtual object to physical server mapping.
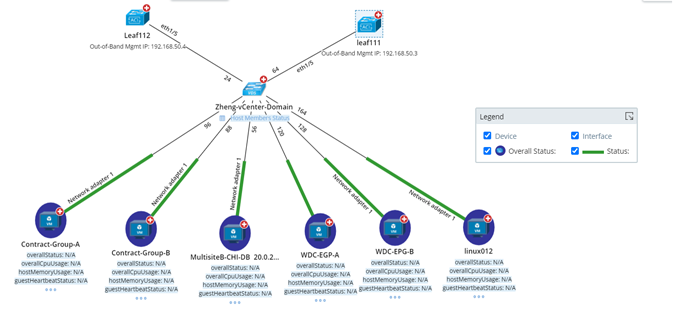
VMware ESXi
The NetBrain system provides end-to-end visibility for VMware vCenter network resources as well as their physical and virtual relationships. With NetBrain, you can quickly understand a vCenter environment in the following aspects:
- What you have in your vCenter networks, such as ESXi hosts, VM hosts, and vSwitches.
- The detailed property information about any vCenter network node.
- The network design between vCenter network nodes, such as Layer 3 connection of VM hosts and their gateway devices, and the (parent/child) relationship between an ESXi host and vSwitch/VMs under the host.
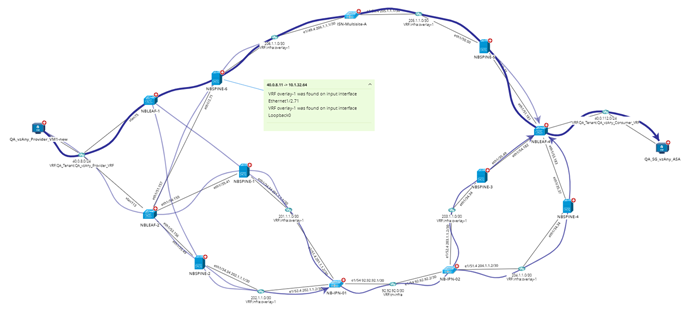
SD-WAN Visibility
A growing reliance on distributed organizations, SaaS, and unified communications is driving the adoption of SD-WAN as an essential business component that must be understood during problem resolution. Single-site operational domains are a thing of the past. With NetBrain, it’s easy to discover and dynamically map your WAN connectivity. NetBrain auto-discovers Cisco SD-WAN, Cisco Meraki, Versa, Aryaka, and CloudGenix SD-WAN connectivity architectures.

NetBrain Retrieves Live Data for Analysis
NetBrain automatically and remotely connects to devices using their native interfaces or directly through their management controllers and retrieves their live production data. Operational and production data includes the configuration, route table, NDP/MAC/ARP table, and device/parameters.
L3/L2 Topology
L3 topology builds Layer 3 topology from IPv4 addresses in the device configuration files. L2 topology builds Layer 2 topology from NDP tables (such as CDP, LLDP, and FDP), ARP tables, and MAC tables. NDP tables calculate the connections between switches, and NDP/MAC/ARP tables calculate the connections between switches and other types of network devices.
Traffic Path Discovery
Basic L3 traffic path — discover and map L3 traffic paths based on routing tables presented to the remainder of the network, while basic L2 traffic forwarding paths are also maintained through our ongoing discovery processes which map L2 traffic paths based on L2 topology.

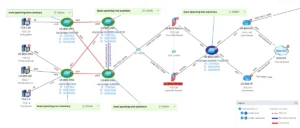
Public Cloud Visibility
NetBrain auto-discovers your end-to-end hybrid-cloud infrastructure and provides native support for Amazon Web Services (AWS), Microsoft Azure, and Google Cloud environments. NetBrain visualizes these with Dynamic Map to show application dependencies across clouds, SDN, and on-premises infrastructure. Automation helps users collaborate and resolve issues faster accelerating troubleshooting via runbook automation. NetBrain Dynamic Map technology provides a single consolidated view of end-to-end operational data that is integrated with the cloud providers’ own native cloud monitoring, logging, and billing tools.
Its discovery engine continuously inventories all devices, their configurations, the connectivity, and the protocols with support for thousands of accounts and millions of virtual servers. This enables NetBrain users to:
- facilitate faster troubleshooting with collaboration across traditional and cloud operations teams
- troubleshoot complex service connectivity issues which include one or more public cloud endpoints
- ensure maximum availability and lowest MTTR for cloud-based applications
- unify all parts of any organization’s digital infrastructure including their public cloud-based services.
Multi-Cloud
Mapping a multi-cloud traffic path is as simple as entering two endpoints (via IP or hostname).
Path logic assesses many traffic-forwarding characteristics like Security Groups and ACL across subnets, VPCs, network virtualization appliances like firewalls, direct connections, ExpressRoute, VNets, and more.
In addition, NetBrain uses a self-designed algorithm to calculate the Virtual Route Table (NCT) for various networking nodes including VGW, Direct Connect Gateway, etc., which is not in the routing table on the cloud console but provides a clearer connectivity understanding for NetBrain users.

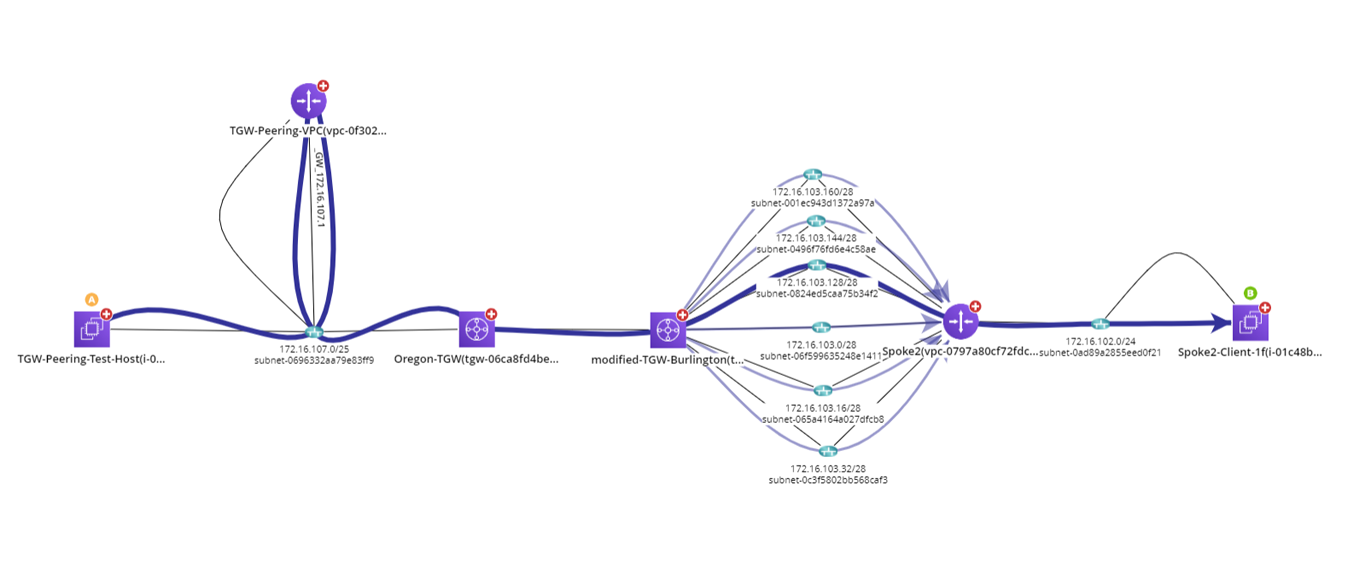
Amazon AWS
NetBrain can discover AWS public cloud resources, visualizing not only all AWS resources like TGW, VGW, EC2 but also topology and techniques like Direct Connect and Site-to-Site VPN used from on-premises to AWS cloud.

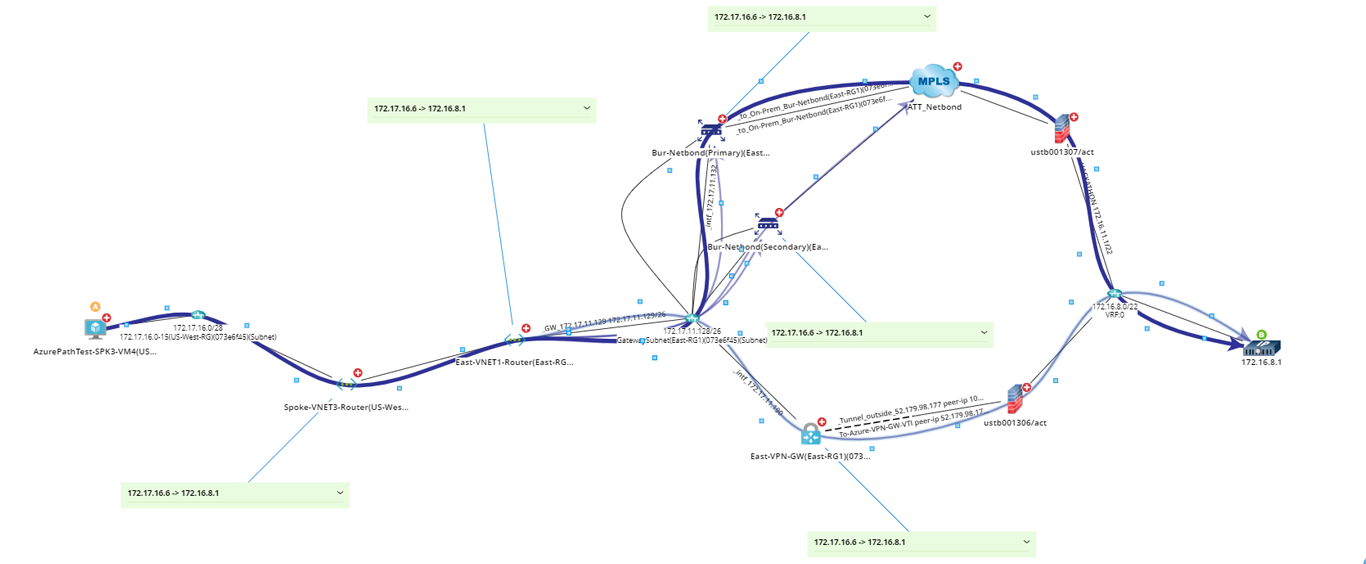
Microsoft Azure
NetBrain can discover Microsoft Azure public cloud resources, visualizing not only all Azure resources like Load Balancer, NAT Gateway, VPN Gateway, ExpressRoute Router, VM but also topology and techniques like ExpressRoute Connection and Site-to-Site VPN used from on-premises to Azure cloud.
Google Cloud
NetBrain can discover Google Cloud public cloud resources, visualizing not only all Google Cloud resources like Load Balancer, Cloud NAT, Cloud VPN, Cloud Router, VM but also topology and techniques like Partner Interconnect, Dedicated Interconnect, and Site-to-Site VPN used from on-premises to Google Cloud.