Network Automation
No-Code Automation
Network Intent
Network Intent revolutionizes network design by offering a no-code approach to auto-discovering multi-vendor network devices and paths, establishing design baselines, and ensuring network design enforcement. With Network Intent, engineers can document design baselines, operational states, and conditions without coding. Most importantly, Network Intent enables the automated validation and verification of network designs. For network troubleshooting, Network Intents, as network automation software, are templatized for scalable cross-network checking of design violations. No-code intent-based network automation proactively prevents network disruption and significantly reduces Mean Time to Resolution (MTTR) when similar problems occur in the future.
- Network Intent describes a network design and intended operational state
- This includes baselines such as configuration and operating state to verify a design is working properly
- They include diagnostic logic based on Boolean commands for easy analysis to check against baselines

This offers a fast and visual way to see if the network has deviated from the design intent and operational baseline
Types of Network Intents
-
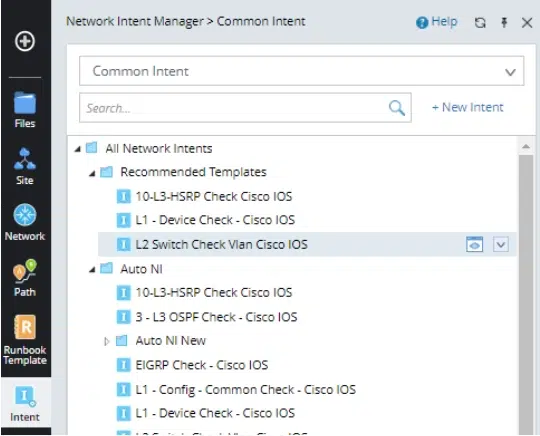
- Stand Alone – network automation Common Intent Resides in a folder in the Intent Manager
-
- Path Intent – Co-exist with a Path
-
- Map Intent – Co-exist with a Map
Creating Network Intent – Visual Parser – Gateway to Programmability without Code
NetBrain’s Visual Parser allows you to quickly turn device CLI/SNMP/API command output or configuration file text into programable variables without coding to enable “What you see is what you can program.” Network engineers can parse the configuration file and CLI/SNMP/API command output for many problems and produce no-code diagnosis automation that can be used by any network engineer.
To support ACI and cloud data using the visual parser, support for the API Parser includes:
- vSupport API in Data Source Definition
- vDefine Retrieve Data Function for API Parser
- vProvide JSON Group to Parse JSON Result
Boolean logic allows complex matching of criteria within a single diagnosis block. Intent Diagnosis supports the AND and OR operators to match multiple conditions.
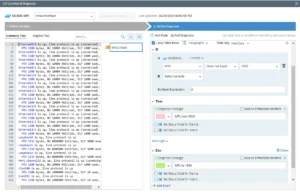
The system allows you to define the following multiple types of parser or parser groups to parse variables. For each type of parser group, a set of parser rules work together to define how variables are extracted from raw text. With valid rules, the parser result is displayed instantly in the output pane, and the corresponding raw data is highlighted on mouseover.
Network Intent as Automation Unit
Each network has its own design intent and configuration standards. By leveraging intent-based automation, NetBrain can check the encoded design intent and configuration standards in the Network Intents against the live network automatically and periodically. These intents can be templatized, stored, and shared across the entire team for scalability.
Modeling the Network into Automation Data Tables
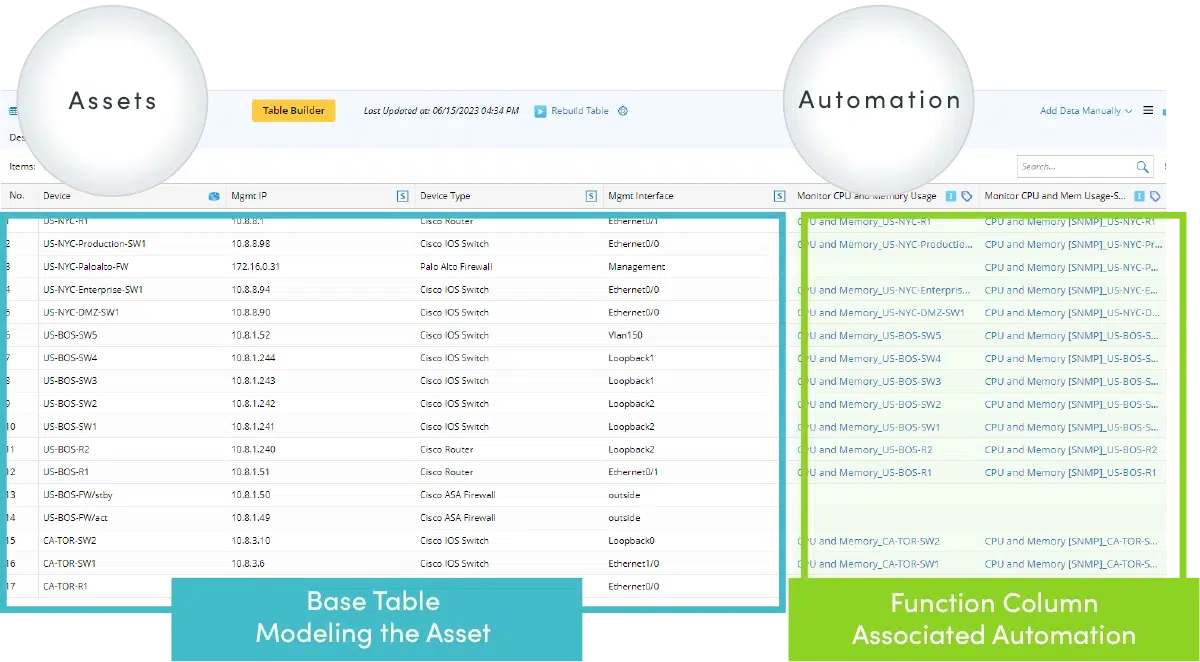
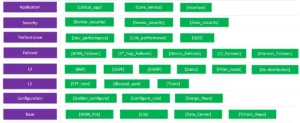
The Automation Data Table (ADT) is a database in NetBrain NextGen that is models critical network assets and helps you manage associated intents while supporting intent creation and replication. Each column represents a new automation. NetBrain’s Automation Library is the backend that builds the intent automation foundation for the ADTs.
- There is only one ADT per function/task (i.e., All app checks, any workflow – preventive, security, health checks, anti-drift (preventive), failover, BGP issues, interface issues, slow app, critical routes, recent changes, firewall policies)
- It allows you to build, organize, and share automation intents across the hybrid-cloud network
- Customize network automation assets in Automation Data Table Manager, such as critical Application and Path, critical WAN Link, critical Device Failover, critical Subnet, and critical Route, then associate intents and diagnosis result for troubleshooting network problem.
Scale Network Intent
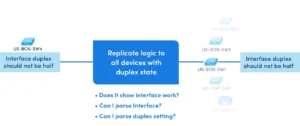
You can resolve thousands of similar problems with a single diagnostic or remedial effort. Capture once and auto-replicate intent across a thousand ‘similar’ devices in any hybrid multi-vendor network.
NetBrain’s Intent-Based Automation proactively validates that your hybrid network is doing the job expected of it and all its applications, catching problems before they impact the business, and conducting immediate root cause analysis to enable faster incident resolution.
If a seed intent meets a critical variable, it can be associated with that device. The NetBrain decode engine in the backend tries the intent on every device to find ones to replicate it using the associated diagnosis logic. From any instance of a path or outage, generate intent to capture knowledge and design. Build one intent for a site and replicate it on any site. Build diagnosis for one area and replicate to all areas.
Ways to replicate intent:
- NIT – network intent template
- NIC – network intent cluster
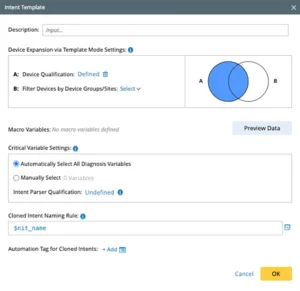
Network Intent Template (NIT) allows you to create an Intent template from a Network Intent. Every Intent is also a template. The Intent template clones the Network Intent to apply the logic to other devices for programable replication control. A user can define NIT for any NI with the single-device diagnosis.
Network Intent Cluster (NIC) is replication for device groups from one network design to a similar network design. NIC is designed to expand the logic of a NI (called a seed NI) from one or a set of devices (e.g., pairs) to the whole network. For example, create a NI to monitor whether failover occurs between a pair of HRSP devices causing the performance issue such as the slow application). Then, use NIC to replicate the logic to all HRSP pairs in the network without any coding.
NetBrain NextGen Platform
The network is a hierarchy of critical assets. NetBrain’s NextGen platform lets you assemble automation in a modular, reusable, no-code method. Re-use automations from across the network stack (any vendor) – for any problem. Multiple issues can reuse the same diagnosis and functions that are stored in a database system called the Automation Data Table that maps network assets to automations, or Intents. Easily add new automations to be instantly used by all incidents.
A module platform that’s:
- Reusable
- Modular
- Scalable
- Easy to maintain
NetBrain NextGen’s no-code automation proactively validates that your hybrid network is doing the job expected of it and all its applications, catching problems before they impact the business, and conducting immediate root cause analysis to enable faster incident resolution.
Intent-Based Automation (IBA) Center
The Intent-Based Automation Center is the central console for leveraging the Automation Library of intents. It also contains pre-built intents ready to use right out of the box that address the most common scenarios, as well as for proactive design-level compliance, security, and application performance verifications. You can publish intents to the IBA Center for automation use and management, including for Auto Intent.
Through no-code mechanisms built into the platform, your own subject matter experts can create the additional situation and site-specific automation routines without any coding and add them to the Automation Library. Once Intents are published to the IBA Center, any network engineer or operator can use the automation routines to quickly and accurately solve problems when they reoccur without code.
The NetBrain IBA Center is leveraged throughout the platform. When coupled with an ITSM/ITOM system, NetBrain NextGen triggered automation will draw from the IBA Center to implement the most useful set of diagnostics in response to specific events.
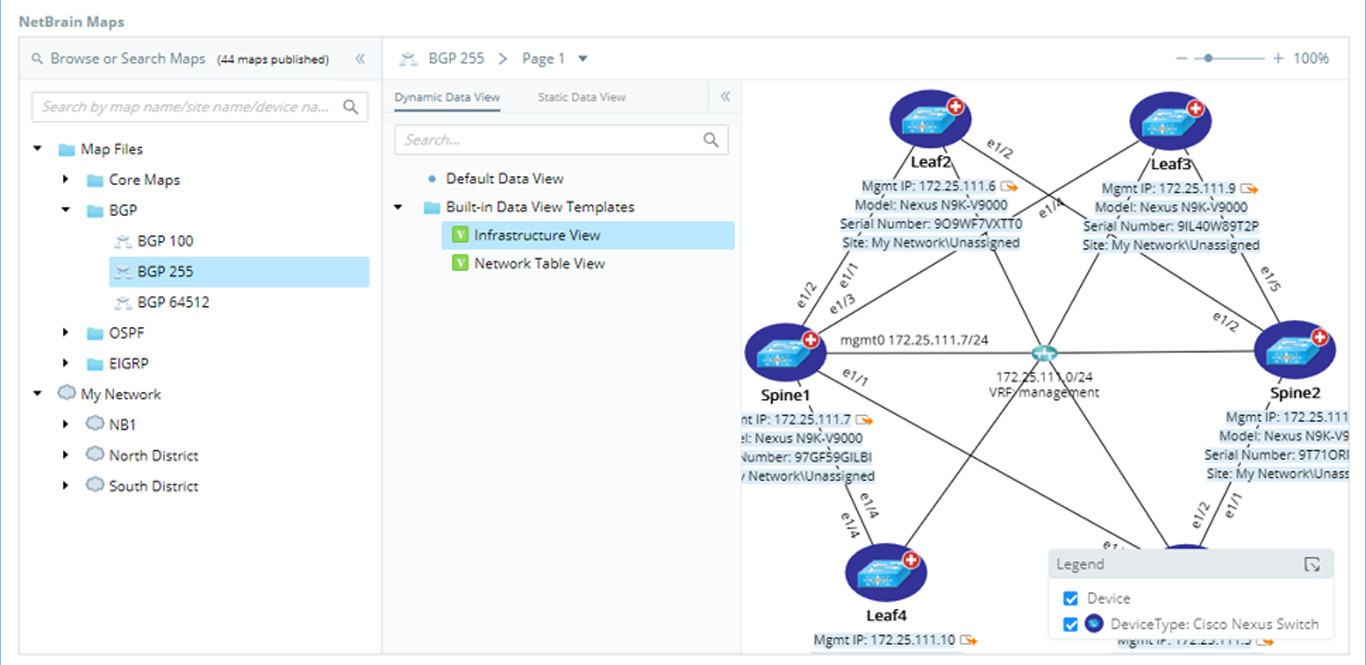
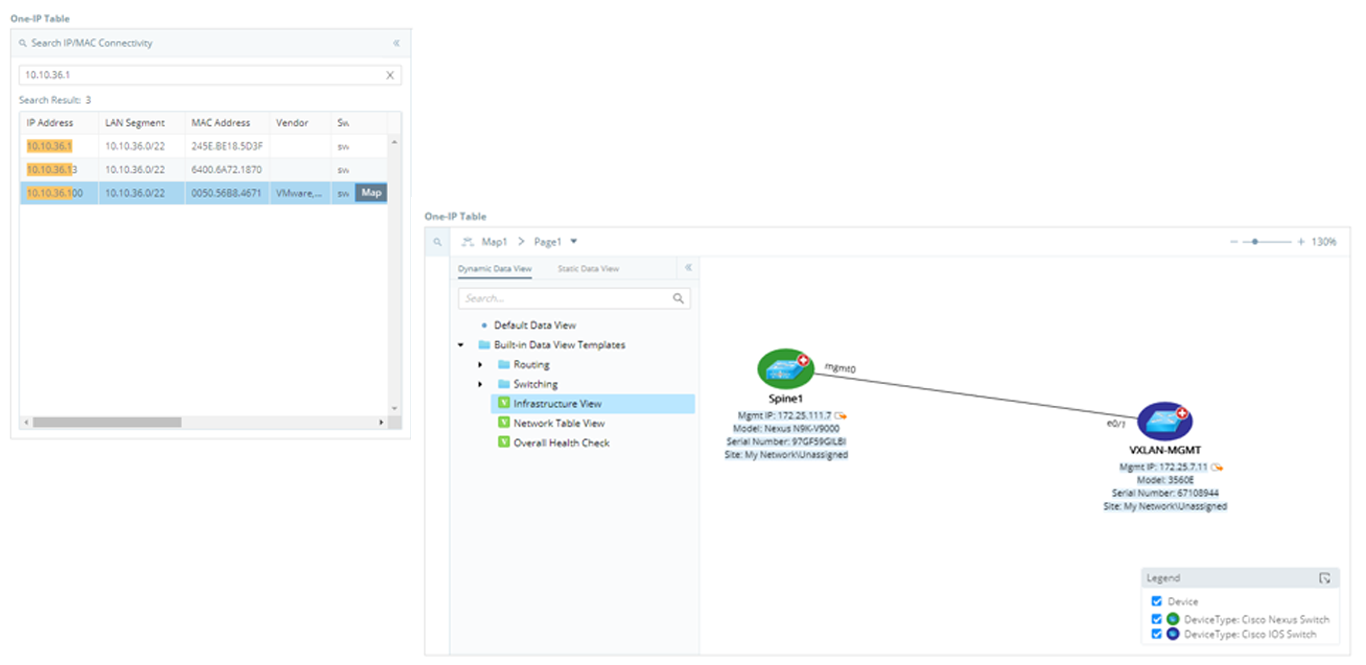
Intent Data View – Using Maps and Data to Troubleshoot Visually
Intent Data View provides the capability to visualize intents on any map, including the network design and the intent status (red or green). The Intent Data View is designed to display the diagnosis data and results on an intent map or any map, so users can view the network design or monitor the network status on the map.
Triggered Automation
NetBrain Next-Gen automates every aspect of the incident workflow from ticket creation to diagnosis to notification. Network Intents can serve as wrappers to call up intents and ADTs.
Follow-Up Diagnosis
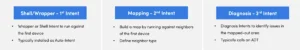
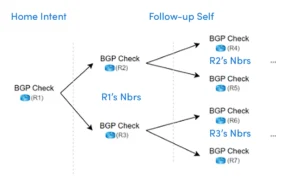
Intent triplet allows massive scale of NI. It nests NIs to perform complex diagnostics on the network.
1st Intent
Network Intent used as “containers” to call follow-up diagnostics such as ADTs.
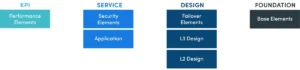
- Typically based on Type of Automation they call:
- Troubleshooting
- Prevention
- Application Impact
- Security
- Change
- Mapping
2nd Intent
An Intent (home intent) can call itself to be the follow-up intent template, under which the same logic will be applied to downstream devices calculated from the home intent. This technology called Follow-up Self, calculates and maps neighbor or path devices and repeats the same diagnosis and runs the same intent on each hop of its neighbors and neighbors of neighbors.
3rd Intent
This is the diagnosis called from the ADT (where) using automation tags (A-tag) (to define what automation).
Triggered Automation Framework
Network problems are often organized by a Ticket System in the form of incidents. In the real world, 95% of network problems are repetitive in nature-identical or similar problem happened again and again but is diagnosed the same way each time without automation. NetBrain provides Triggered Automation Framework (TAF) in NetBrain to fill in this gap.
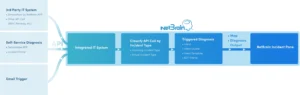
Triggered Automation Framework (TAF) provides powerful event-triggered diagnosis by executing Network Intent automatically for incoming tickets. There are two ways to trigger the diagnosis:
- an external ticket from the 3rd party system (an API call from the machine to machine)
- a self-service call from Chatbot, Emails, ServiceNow App, and Incident Portal (an API call from human to machine).
For both types of trigger, TAF matches it with suitable intent based on pre-defined criteria to perform triggered diagnosis. The results are displayed in the Incident Pane.
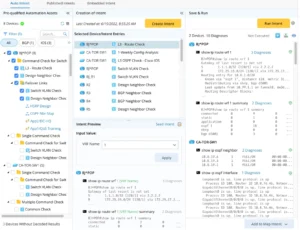
Diagnosis Tree
Humans need decision trees but it’s very slow to create them. NetBrain minimizes the number of actions that you have to take and creates a fully interactive one instantly. The machine creates it fast in parallel to your work so it’s more efficient and you can even pre-program it.
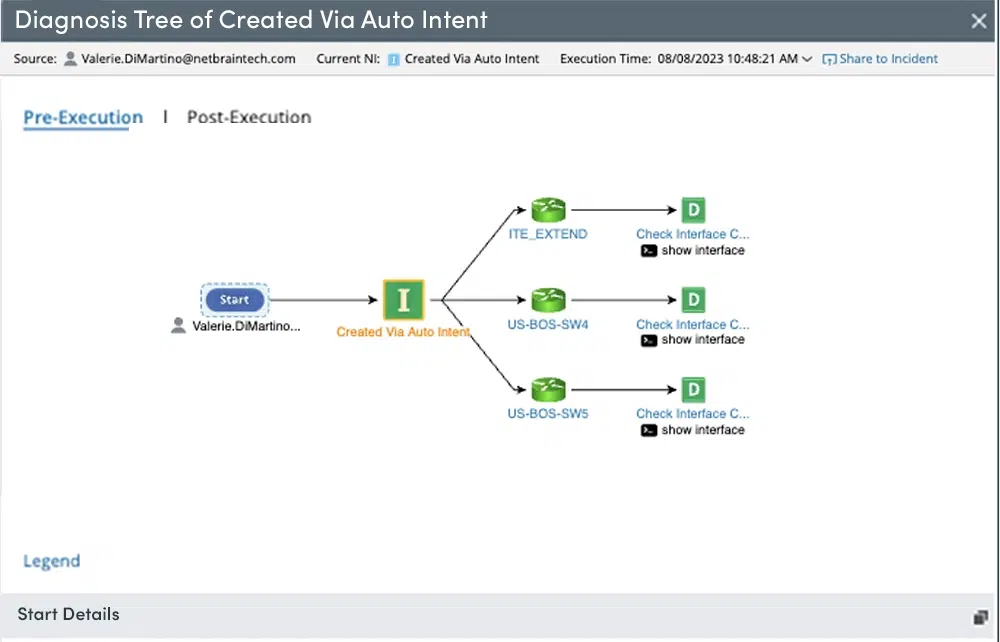
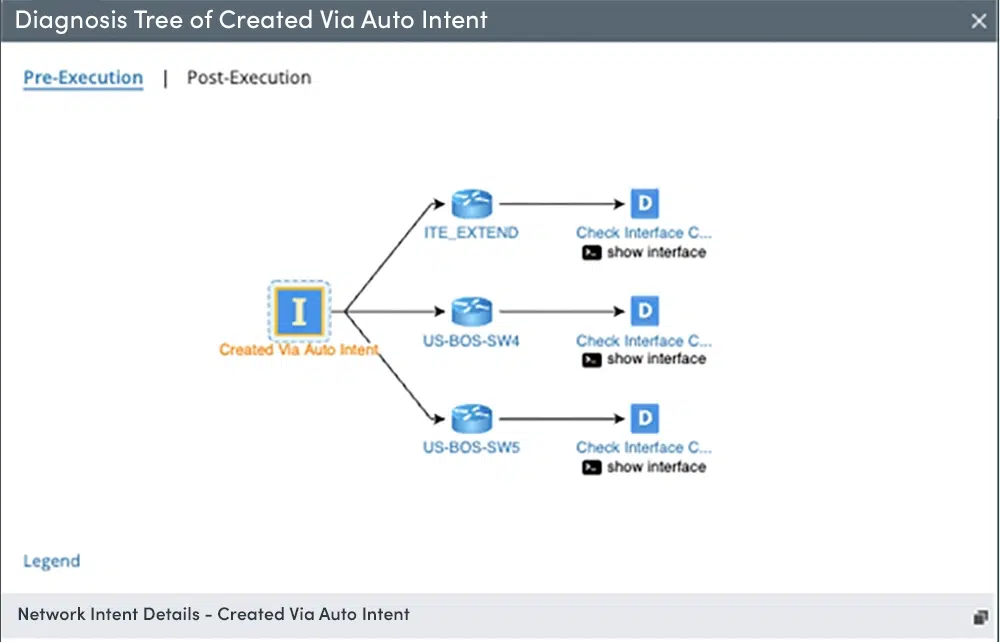
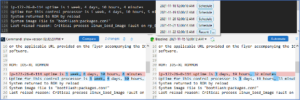
Double-click on any device to see the details and the CLI. Double-click on diagnosis and see what was looked at and compare and uncheck changed and unchanged for improved ease of use.
Diagnosis Tree (Pre-Execution): reflects the diagnostic logic and the troubleshooting design.
Post-Execution Diagnosis Tree: shows the execution status of follow-up diagnosis based on the designed Diagnosis Tree (Pre-Execution). After a NI is executed, you can view its Diagnosis Tree (Post-Execution), Each execution result at a different time has its own independent Diagnosis Tree (Post-Execution).
Triggered Diagnosis Integration with ITSM systems
Integrate NetBrain Next-Gen with ITSM systems such as ServiceNow, Jira, or BMC Remedy enabling the next tickets to be diagnosed by the automation engine.
Integration between NetBrain NextGen and the ITSM system could be done in one of the two methods:
- Through a purposely built integration app, such as ServiceNow App, Splunk App.
- Through a RestAPI library, such as BMC integration.
After ticket system integration, a new ticket that has fields matching the trigger rules will send an API call to NetBrain with a pre-defined payload; NetBrain in turn will launch the following actions:
- Incoming API calls will be classified into a pre-defined “incident type”
- Incoming Incidents will be merged into an existing NetBrain incident or a newly created one.
- A dynamic map is created or opened for the incident
- Matched diagnosis executed
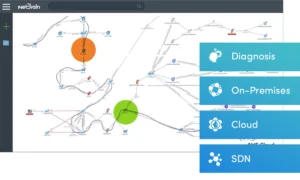
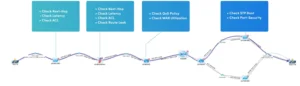
Path-Based Troubleshooting for Application Performance
- Calculate and compare all application paths against baseline paths from on-premises to cloud
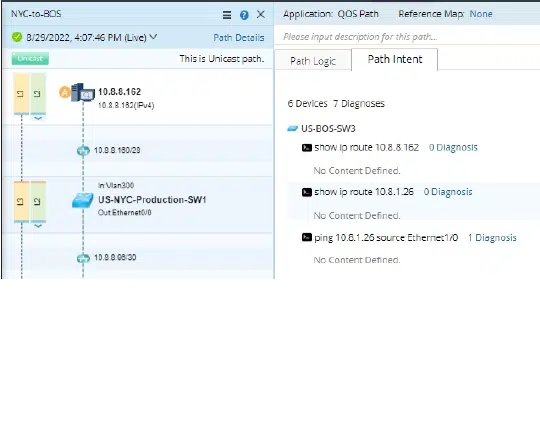
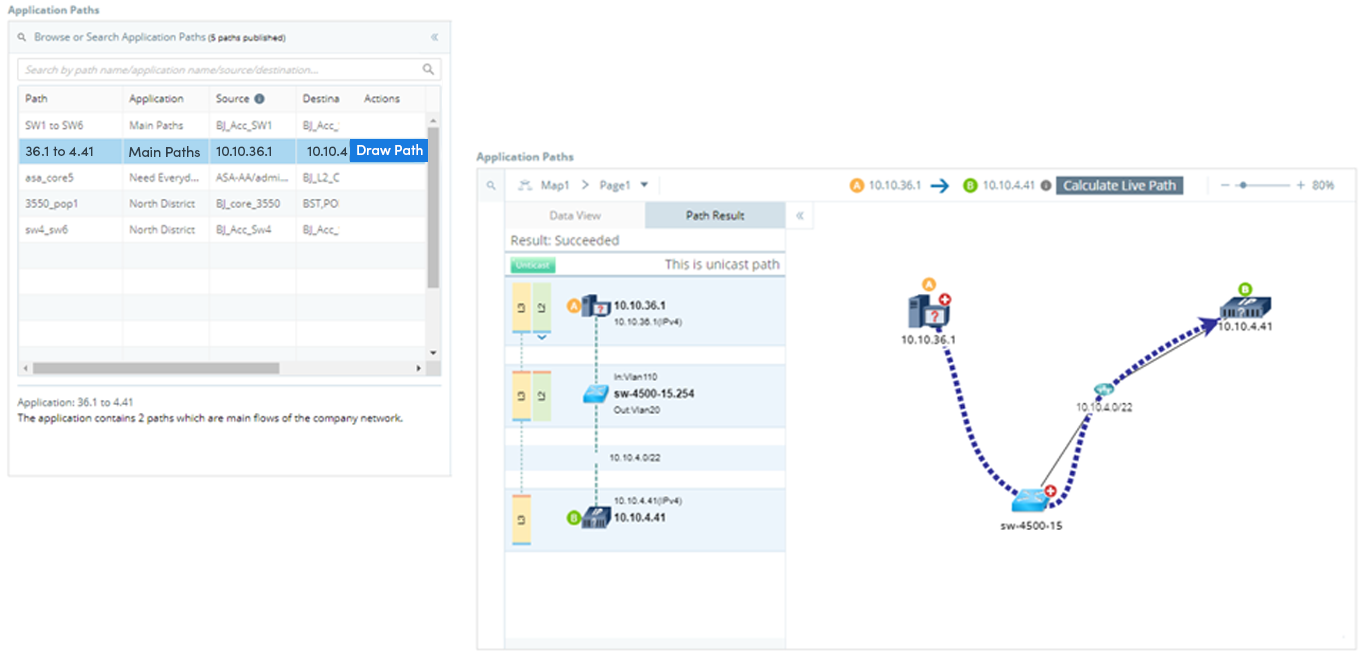
Path-Based Troubleshooting of Application Traffic Flow with Intent
- Diagnose and troubleshoot application paths visually via Path Intent
- Path Intent allows engineers to build path-specific checks for each device and save those checks along with the path and map
- A check can include connectivity, performance, and security
- Path Intent allows engineers to build path-specific checks for each device and save those checks along with the path and map
- Clone Intents for thousands of paths
- Use Auto-Intent to Create Device-Specific Intent for Path Intent (One device at a time)
- Use Path-Specific Intent Template to Replicate Intent (One path at a time)
- Use ADT and Path-Specific Intent Template to Replicate Intent (Many Paths at a time)
- Continuously monitor thousands of paths for incident diagnosis and prevention with Calculate Path and Execute Path Intent
- View outcomes in path batches
- Display Path Verification and Path Monitoring for Application Performance in a Dashboard
Notify Users or 3rd-party Systems with Alerts
 Generate intent-based automation alerts and share them with other users by email. You can subscribe to certain types of alerts and stream them to your alert or incident management system for handling.
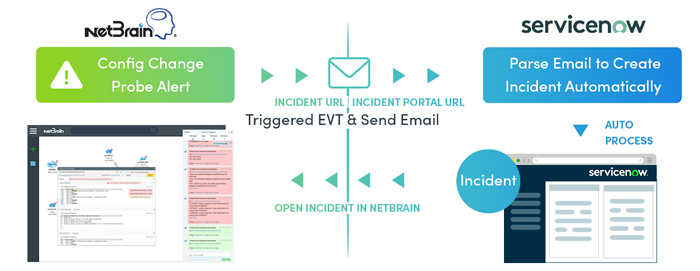
Email alerts can be used to create tickets for 3rd-party systems (e.g., ServiceNow). NetBrain creates internal tickets with the NIT diagnosis results. View the ticket created in the ticketing system and use the link to open the incident in NetBrain.
Webhooks to ITSM Systems
Webhooks are APIs that allow two systems to talk to each other. It’s a simpler API that you can call to notify a receiver of a dynamic payload (e.g., a ticket ID for closing a ticket). NetBrain sends an email with details from the Intent execution to the ticketing system automatically. This allows for creating, updating, and even closing tickets based on the results of the Network Intent.
Self-Service Automation
Network performance problems and other service-level incidents may come to the attention of various support teams outside of the typical NetOps channels, so allowing any support team to interact with NetBrain’s intelligence is imperative. Users can trigger problem diagnosis automation directly from ITSM solutions (such as ServiceNow), via Microsoft Teams, or even with nothing more than an email to quickly reduce data gathering time, MTTR, and further escalations.
Self-service automation empowers all levels of the support process. With self-service options, any support personnel, not just network engineers, can participate in the high-level diagnosis of the network and resolve issues long before network engineers are assigned. The system, security, application, and even level-1 helpdesk engineers can access network automation to quickly diagnose issues in real-time- while the problem is being observed. Self-service options can be customized by role and results can be provided either from the management console or the incident portal allowing for access at all levels of the escalation path.
Self-service from ITSM
Self-service automation resides within incident-based collaboration systems including NetBrain’s Incident Portal and incident pane or integrated ITSM tools like ServiceNow. Much like cases where ITSM triggers NetBrain automatically, self-service allows the problem to be remediated in a fraction of the time a typical NetOps response would incur.
Integration with ITSM system serves two resource-related purposes:
- For non-structured tickets created manually, when automated trigger rules are not activated, users can manually launch a diagnosis with a similar effect to the automated trigger.
- For senior network engineers resolving an IT problem to share automated diagnosis functions with junior network engineers or non-network engineers without login to the NetBrain system.

Interactive Automation
Interactive Automation
Interactive Automation is when NetBrain intelligence records network engineers’ diagnostic steps to create automation for their own use, enabling them to be more productive by getting data from multiple devices, looking for changes by executing a comparison automatically, and monitoring and getting alerts for threshold changes. It offers guardrails for any operator or engineer to make informed decisions based on network real-time status.
As networks get larger and more complex, automated documentation becomes more important, especially as networks incorporate technologies like SDN, SD-WAN, and public cloud. NetBrain not only provides end-to-end visibility across hybrid networks but also the ability to drill down into each segment and isolate network issues on a Dynamic Map that can be updated in real-time. This greatly accelerates problem identification and resolution. And when new devices are added or removed from the network, the documentation is quickly reflected in an updated network map which is exportable as diagrams to Microsoft Visio and Word.
With NetBrain, NetOps professionals leverage their own expertise to automatically record standardized procedures in a runbook as they detect, diagnose, and fix issues. The steps they use to diagnose issues, including the use of CLI commands on multiple devices, are automated in Runbooks.
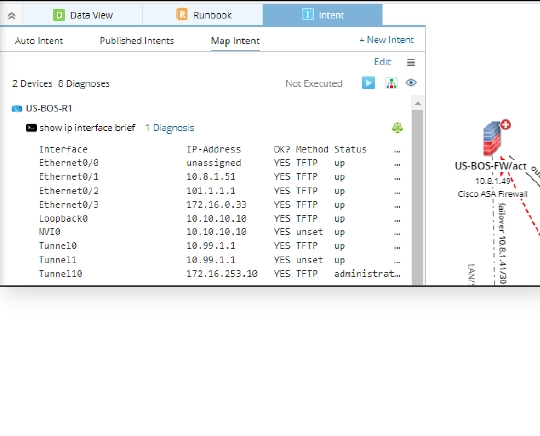
Auto Intent
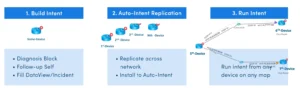
Auto Intent enables users to build intents, replicate them on other devices, and run them for devices on a map.
Managed in the IBA Center, enable Intent Templates for Auto Intent, so that end users can replicate intent templates and customize the macro variables if necessary to create appropriate intent for map devices.
In the Auto Intent, input a macro variable and seed intent. To do a multi-cast map, put the multi-cast address in as a macro variable. To do a ping, put the target in as a variable. The platform uses programmable logic to call any intent on the fly with triggered automation.
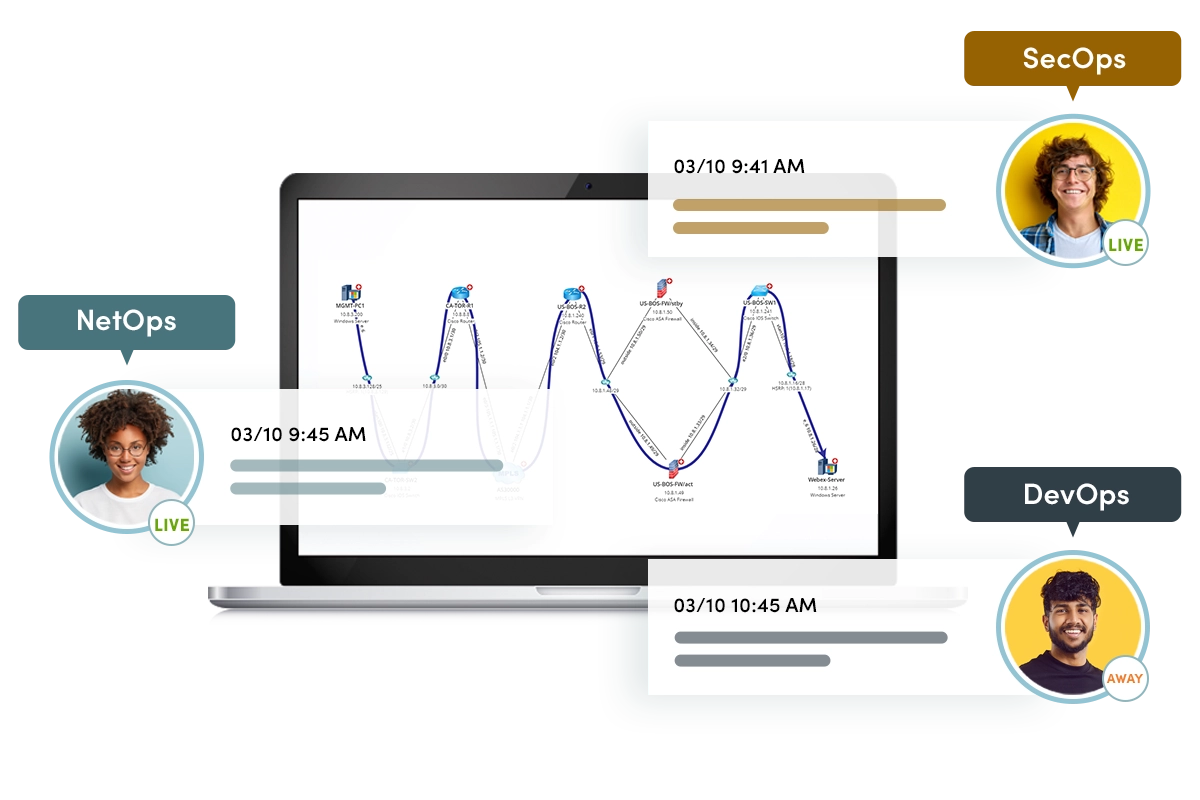
Collaborative Automation
Collaborative Automation is where engineers and operators leverage the knowledge of peers with software that captures subject matter experts’ knowledge to create executable automation units that others can then add to their own diagnoses. Expertise is available even when the expert is not. NetBrain helps when troubleshooting a problem, assessing the state of the network, or making sense out of complex technology. It allows the NetOps staff to gather, analyze and visualize 1,000s of KPIs in seconds. It can be coupled with our collaboration capabilities to allow multiple ops teams (SecOps, DevOps, NetOps, ServerOps) to interactively resolve problems that span multiple technology domains without the need for time-consuming handoffs which result in delays. Everyone can get online at the same time and interact and make updates and remediations to the model through a shared analysis console.
NetBrain captures and codifies the SME knowledge using Runbooks, Data Views, and Network Intents. Automatically capturing this information allows experienced engineers to codify and share their knowledge with junior staff, effectively shifting knowledge left, from experienced users to less experienced team members The next time the problem occurs, the runbook is executed by responders without in-depth knowledge or training. Even complicated network issues no longer need to be handled exclusively by experts. You are essentially using the knowledge of these highly skilled level-3 workers when they are otherwise unavailable (due to location or availability).
Incident Portal
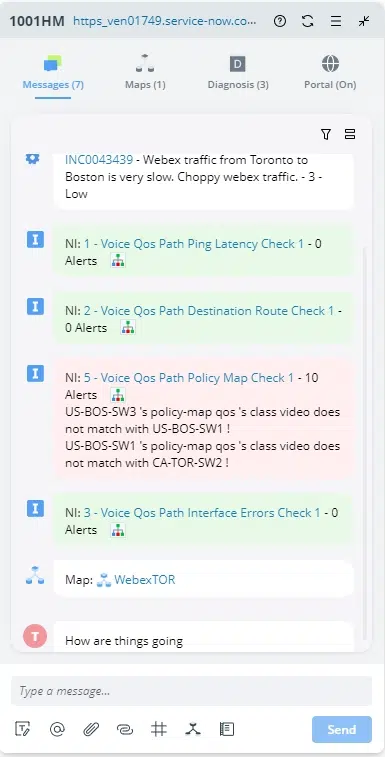
NetBrain’s Incident Portal enables collaboration among multiple users working on the same troubleshooting task. An incident represents a ticket in NetBrain to track a network problem or a network change. End users can organize and share maps, devices, individual insights, and findings targeting a specific troubleshooting task and collaborate with more colleagues to resolve issues reducing MTTR.
In addition, Incident Portal offers an independent portal page for each incident. External users without NetBrain Workstation seat licenses can access a portal to join the collaboration session by viewing maps and posting messages, etc.
The Function Portal feature enables network engineers to collaborate with their NetOps colleagues and with members of other operational teams who are not initially involved with a service ticket.
This is one of the key approaches to achieving the goal of reducing service ticket overhead and improving team productivity and MTTR. With Function Portal, users from multiple teams (IT engineers, security engineers, etc.) work together to resolve complicated problems that would otherwise require hand-offs and wait for resources to become available.
Runbooks
- Runbooks document procedures for documentation, assessment, and troubleshooting using familiar CLI-based tools
- Runbook templates can be used to standardize processes
Runbooks are a set of visual operational steps that engineers create by capturing their step-by-step workflows along with intents to allow the automation of future problem diagnosis, network data collection, and troubleshooting tasks. Runbooks provide a visual way to codify the network troubleshooting process into an executable, reusable, and documentable workflow. Subject matter experts can digitize their knowledge into a runbook template to capture best practices and remediations that other operators can use. Once Runbooks are executed, the results can be shared with anyone in the organization, facilitating collaboration and enabling higher-level engineers to code their advanced knowledge into repeatable automation units.
Runbooks contain actions that can perform complex network tasks automatically, providing the user:
- Command Line Automation
- Enhanced Incident Collaboration
- Streamlined Knowledge Sharing
Runbooks can leverage datasets from third-party tools, enabling users to visualize information from all their existing tools into its Dynamic Map.
Runbooks At-A-Glance
• Automate network operations on a large scale
• Effortlessly collaborate with multiple engineers using the same Dynamic Map
• Share and save network insights as to the groundwork for future troubleshooting
SmartCLI
SmartCLI integrates a familiar tool (CLI via telnet/SSH) into NetBrain. It provides interactive troubleshooting with traditional CLI-based tools such as show commands, ping, and traceroute.
Preventive Automation
Preventive Automation Framework (PAF) Overview
NetBrain’s preventive automation addresses human error concerns, well-known problems, and non-compliant devices are considered the top root causes of network impact and downtime.
Network Intents continuously and automatically verify the operational status of the network to fix issues before they cause outages.
The automated diagnosis and rule check are triggered by early warning alerts from a set of logic probes. Together, PAF is different from traditional monitoring systems, in that:
- PAF is designed to enforce design and security rule checks automatically, not monitoring system errors
- PAF must be customized based on network design, not one-size-for-all.
- PAF can serve as a next-gen compliance check solution – it’s a 24X7 compliance check.
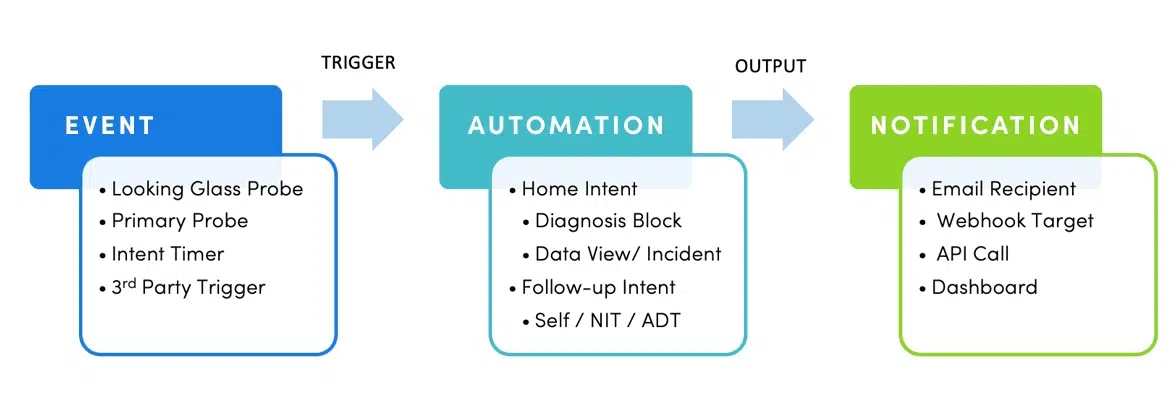
Early Warning Detection via Events
Preventive Events
- Looking Glass Probe – Similar concept to BGP Looking Glass. Strategically locate your Looking glass device to oversee your infrastructure (OSPF routing area, BGP routing, etc.). Reduce system resource consumption for high-frequency checks.
- Primary Probe – Regular probe that checks for device events, such as variable values not matching baseline, configuration changes, interface events, and more.
- Intent Timer – Time-based probe. Execute automation based on frequency.
- External Probe – Third-party system event (SolarWinds, SNOW, etc.).
Probes
The PAF triggers virtual probes that run NIs to identify network anomalies and alert you to the first occurrence and transient problems. These consist of:
Internal Probes
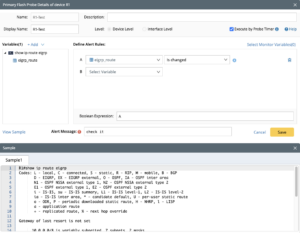
- Primary Probes: Primary probes use Network Intents to check for anomalies (e.g., device configuration changes and interface errors) and poll at any desired frequency. NetBrain supports two types of primary probes:
- Alert-based Probe: triggered by a device-generated anomaly (configuration-related information).
- Timer-based Probe: triggered by an interval timer and can be used for scheduled CLI and scheduled NI tasks.
- Secondary Probes: Secondary probes are only triggered by primary probes because of an alert when more detailed diagnostic investigations are needed.
External Probes are used for integration with other monitoring systems. Once the integration is complete, the alert triggered by 3rd-party systems can implicitly generate external probes.
When NetBrain probes detect alerts, they automatically send notifications to engineers.
It can horizontally scale as:
- Distributed analysis on front servers: the data retrieval and flash probe calculation are executed on front servers locally, which can be scaled to a very large network with distributed front servers.
- Hierarchical analysis from Primary Probe -> Secondary Probe-> Network Intent: the hierarchical design allows the system to efficiently use the resources to run Network Intent automation across the entire network.
Timer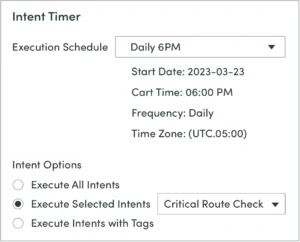
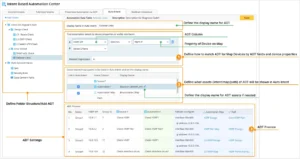
An Intent Timer can run ADT intents at certain-defined intervals against established baselines in support of network compliance and audits. At any desired interval, before deteriorating conditions can generate alerts, it tests network intents against the baselines and provides an advanced warning.
IBA Center Preventive Automation via ADT – Intent Timer
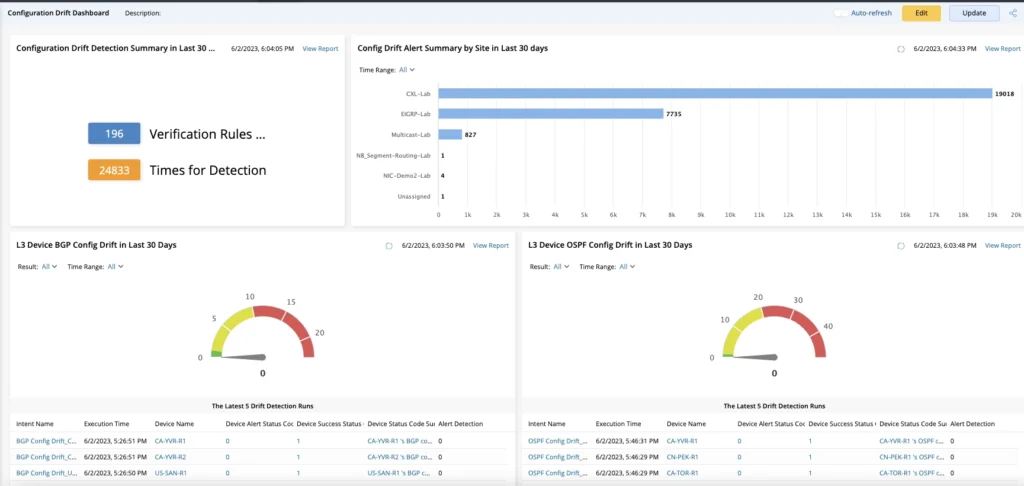
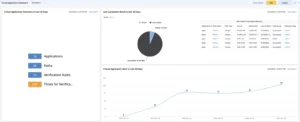
Reporting Dashboard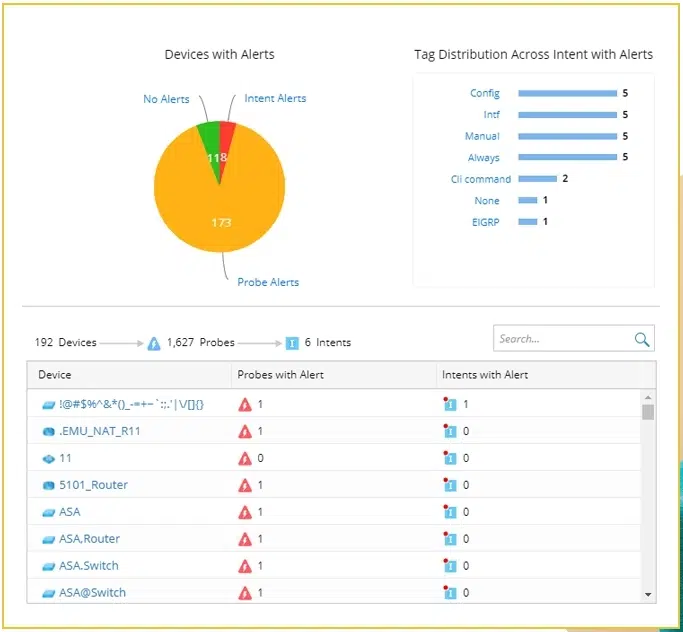
NetBrain displays the data from the probes in an easy-to-use Preventive Automation Dashboard showing the number of device alerts by probe and by Intent.
Automate Compliance and Security Checks
Preventive Automation allows you to define the compliance and security check rules within Network Intents and expand the check to the entire network via Network Intent Cluster, which the system executes automatically.