 by Mark Harris Nov 22, 2017
In this week’s “tips and tricks” blog, I’ll discuss one of the most frequent scenarios network managers face: how to troubleshoot a slow application.
When a user is experiencing a slow application, everyone points their finger at the network. In most IT departments, rarely is a sole individual in charge of application performance. Network managers, database managers, server managers, and even application programmers are typically held collectively accountable. But it’s the network managers who are often left holding the ball after the other teams have performed their analysis. That’s because it can take days to track down whether a network problem is impacting application performance.
You can leverage network automation within your existing troubleshooting workflows to diagnose slow applications more effectively. You can instantly create a Dynamic Network Map to identify the segment of the network responsible for forwarding the application traffic. Then, you can drill down with automation to diagnose the network’s performance, find routing changes, and identify configuration discrepancies.
Click here to see it in action!

Map the Application Flow
Suppose a poorly performing application traverses the network across three data centers. To troubleshoot the issue, a single network diagram with the relevant devices from the three data centers is required, not three separate diagrams with all devices in each data center. In other words, a targeted map is the best troubleshooting asset. With NetBrain, you can enter the source and destination addresses of the application to map the real-time flow.


Layer-3 and Layer-2 Map of an Application Flow
In some cases, the routing of application traffic may be asymmetric (traversing a different return path). To determine whether the application you’re troubleshooting is experiencing this kind of asymmetric routing, you can quickly map the reverse flow path to see how traffic flows back from point B to point A:
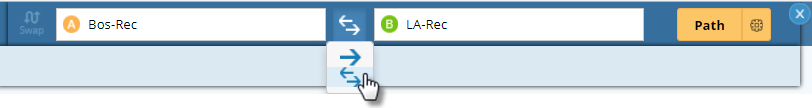

Asymmetric Routing of Application Traffic Flow

Automate Performance and Config Diagnosis
A NetBrain Qapp provides a way for you to collect the performance and configuration data you’re looking for without having to log into a bunch of devices serially and type in a string of show commands. NetBrain has several built-in apps that can automate application performance tests and debug configuration issues. Most importantly, you can easily write your own apps to automate much more. These apps leverage the map as the ‘canvas’ for your targeted data analysis.
Recommended App: Layer-4 Port-Level Analysis
For modern networks, it’s not enough to analyze application traffic at the IP level because ACL, QoS or NAT technology can impact the application flow at the port level. For example, a server may be accessible through a web browser (operated at port 80/443), but telnet traffic (at port 23) could be denied. Using the Layer-4 Port-Level Analysis app, you can specify the layer-4 protocol and port number to identify traffic forwarding rules and restrictions specific to the defined port.


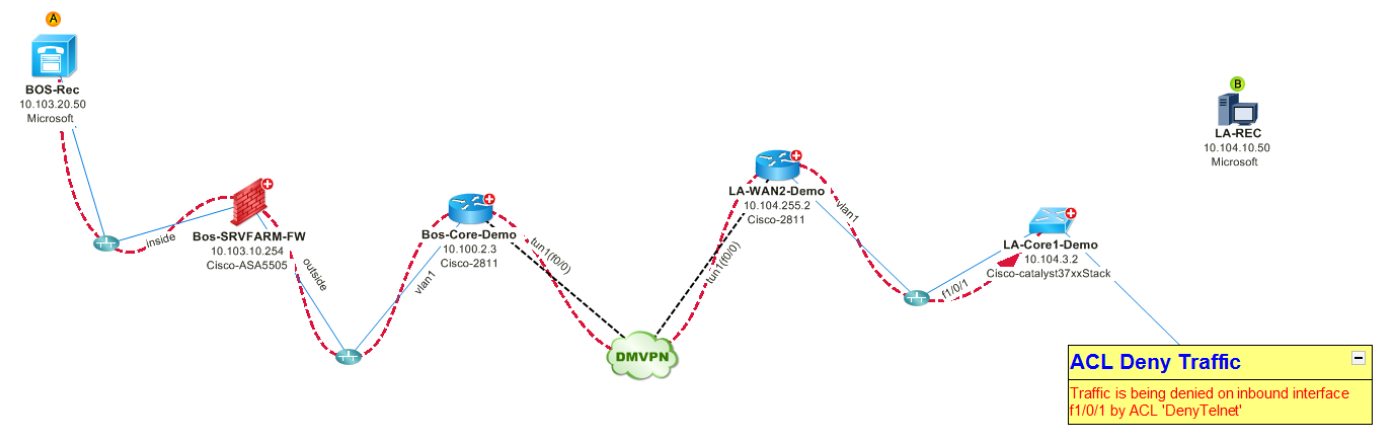
Identify Traffic Forwarding Rules and Restrictions
Discover Changes in Traffic Flow
A recent configuration or routing change may have inadvertently impacted application performance. Therefore, it’s often a good idea to ask ‘what’s changed?’. This app can help identify changes in topology, by mapping the flow as it looked at a previous point in time.


Identify Changes in Topology and Routing
Recommended App: Overall Health Monitor
When an application is running slowly, it could be due to congestion on the network, excessive link delay, or faulty hardware. The Monitor Network Health app will perform a continuous SNMP scan of the relevant network to determine device availability, device health, and link performance (delay, errors, and utilization).

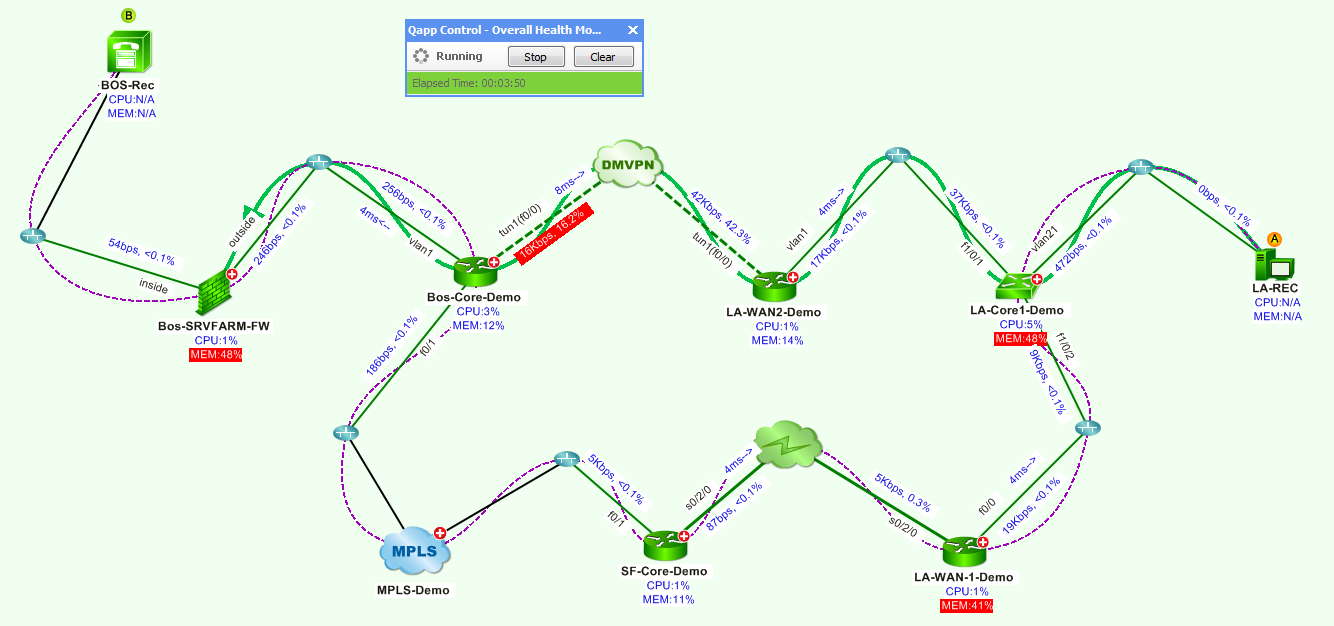
Display Live Device and Interface Performance Data
This app will generate alarms if any threshold is exceeded. So if a device goes down, or a link gets clogged up, you can be alerted that the network is behaving symptomatically. Further, the app will plot this data over time, so you can see if any spikes are leading to intermittent problems.

Recommended App: NetFlow Analysis
If your devices are configured with NetFlow, you can leverage the NetFlow Analysis app to analyze bandwidth bottlenecks. Drill-down into any interface’s bandwidth utilization data to see the relevant NetFlow data, such as source and destination ports and interfaces. You can also identify top-talkers who are hogging the bandwidth and causing the bottleneck.

Identify top talkers with netflow
These are just a few ways you can point to the network if there’s a slow application (or clear it from blame!). If you want to try these features out for yourself, please checkout our technology labs – accessible inside NetBrain’s Instant Trial!