 by Jan 3, 2018
This executive summary recaps our Reduce MTTR and SLA Violations webinar, now available on demand — no registration form required.
Network teams are increasingly feeling the heat to realize “five-9s” uptime (99.999% availability). That’s less than 5 minutes, 17 seconds of downtime a year. With most organizations experiencing 4-5 outages each year, you have about one minute of repair time per outage.
You’ve spent a fortune building in redundancy, you’ve automated your monitoring and ticketing systems, yet a 2017 NetBrain survey found that it still takes over 80% of enterprises more than an hour per outage to get back up and running. The math just doesn’t add up.
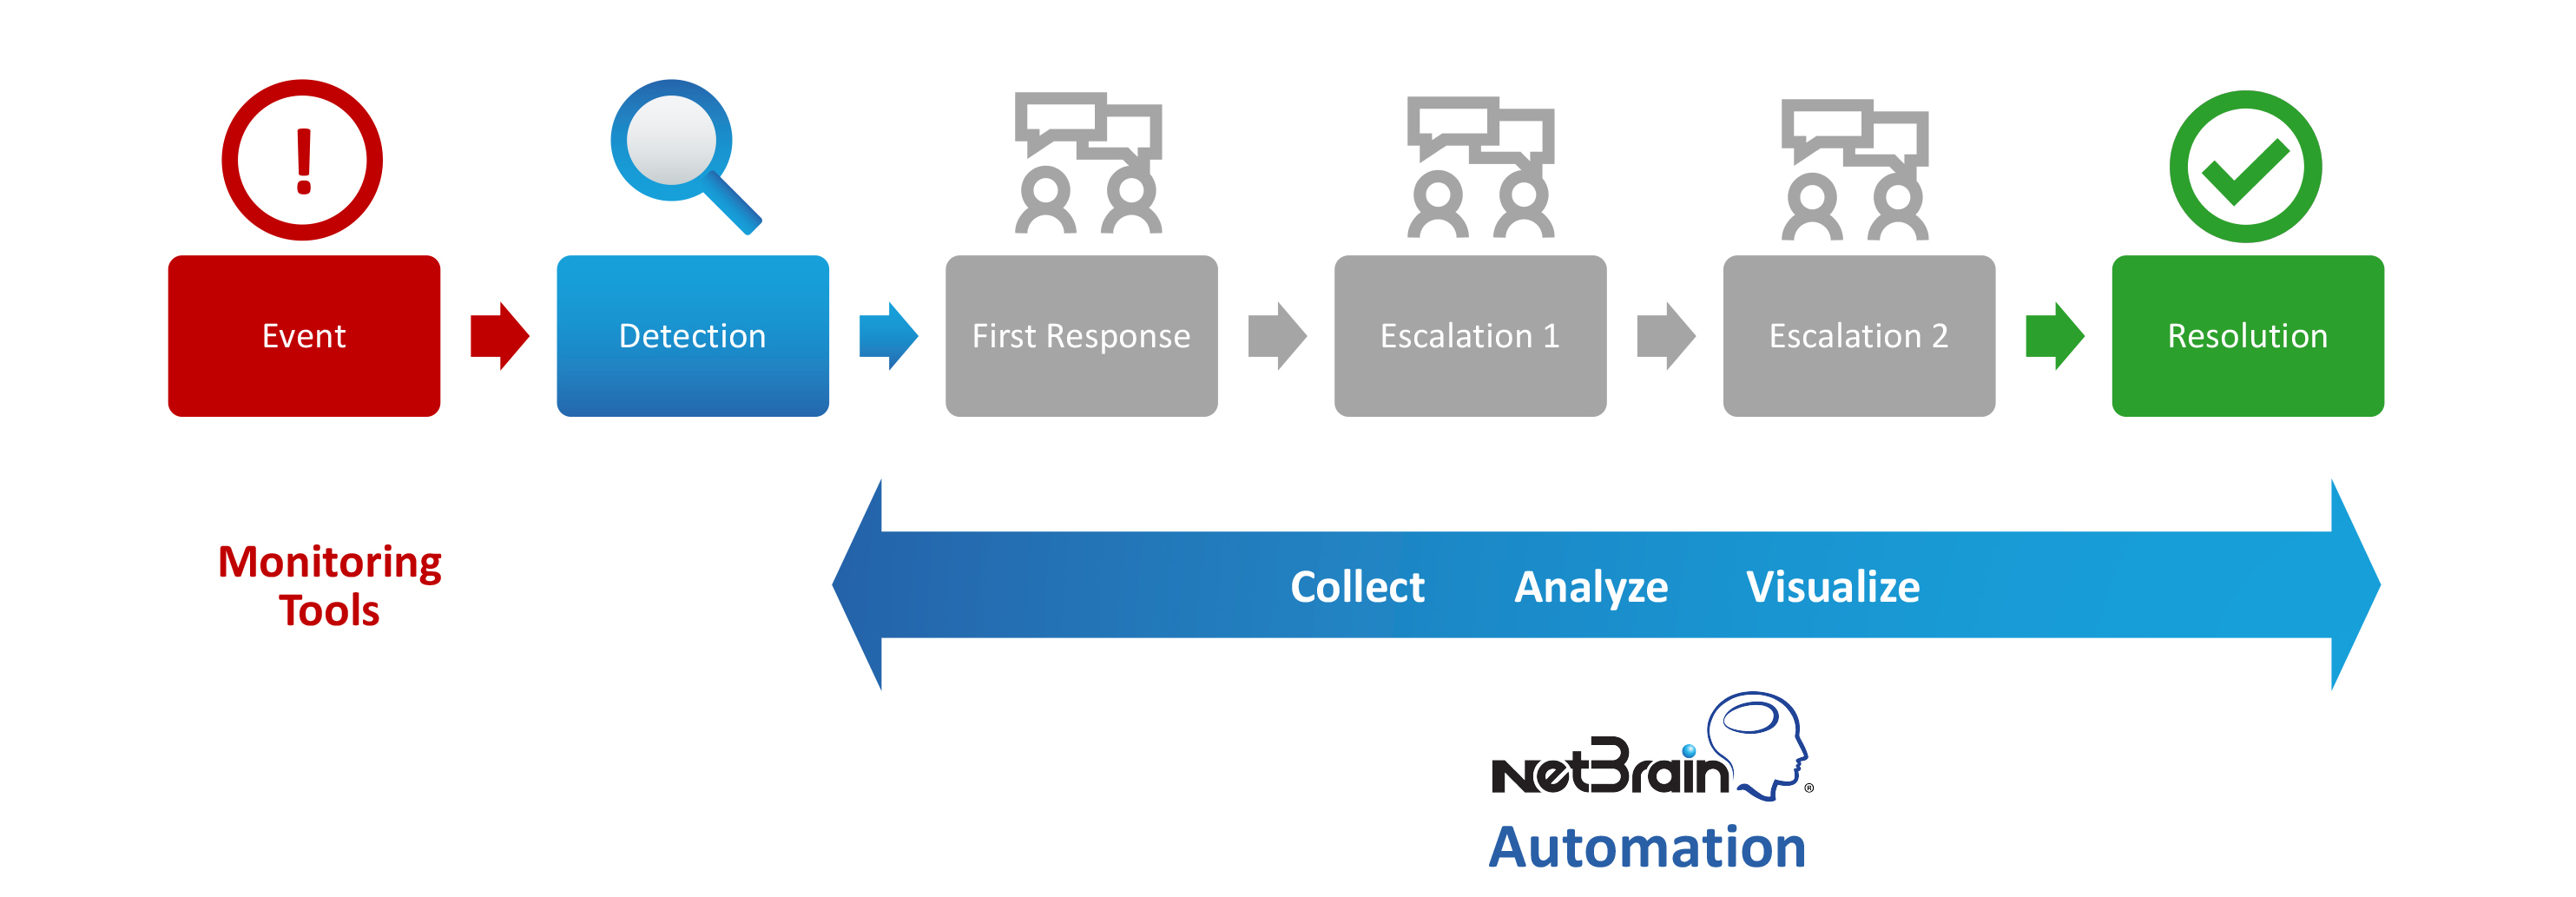
The only way to reduce MTTR down from an hour to about a minute is to automate the troubleshooting steps between detection to first response to escalation to resolution. Relying on traditional, manual methods of troubleshooting is like bringing a knife to a gunfight.
Relying on traditional, manual methods of troubleshooting is like bringing a knife to a gunfight.
Four Challenges Between Detection and Resolution
The 2017 NetBrain survey identified four key challenges between detection and resolution — the obstacles to reducing MTTR:
- First responders lack the required visibility to solve the problem at hand.
- Data collection is extremely time-consuming through CLI.
- Lack of collaboration between teams delays resolution.
- Problems disappear before first responders even get to them.
1. On-Demand Mapping Is a Must
About 43% of network teams lack up-to-date diagrams to tackle the problem at hand — either depending on manual documentation tools like Visio (with diagrams becoming obsolete almost as soon as they’re created) or falling back on the “tribal knowledge” of the most experienced engineers. You simply cannot troubleshoot quickly or effectively unless you know exactly how traffic is actually flowing across your live network. After all, you can’t fix what you can’t see. Relying on traceroute limits your understanding of what’s going on; NetBrain, on the other hand, gives you full end-to-end visibility of all the combinations of traffic paths in just seconds.
NetBrain Dynamic Maps visualize any network data and show it to you in context on a “clean canvas,” so you don’t drown in a sea of irrelevant details. You see not only the basic topology but also the underlying design, configuration, real-time performance details, and – perhaps most important – historical information. You get immediate answers to the foremost question of troubleshooting: What changed? Leveraging recurring snapshots of the network, NetBrain performs comparative analysis to find changes in configuration, routing, and much more.
And because NetBrain maps are built using live network data, they’re always up-to-date, always accurate.
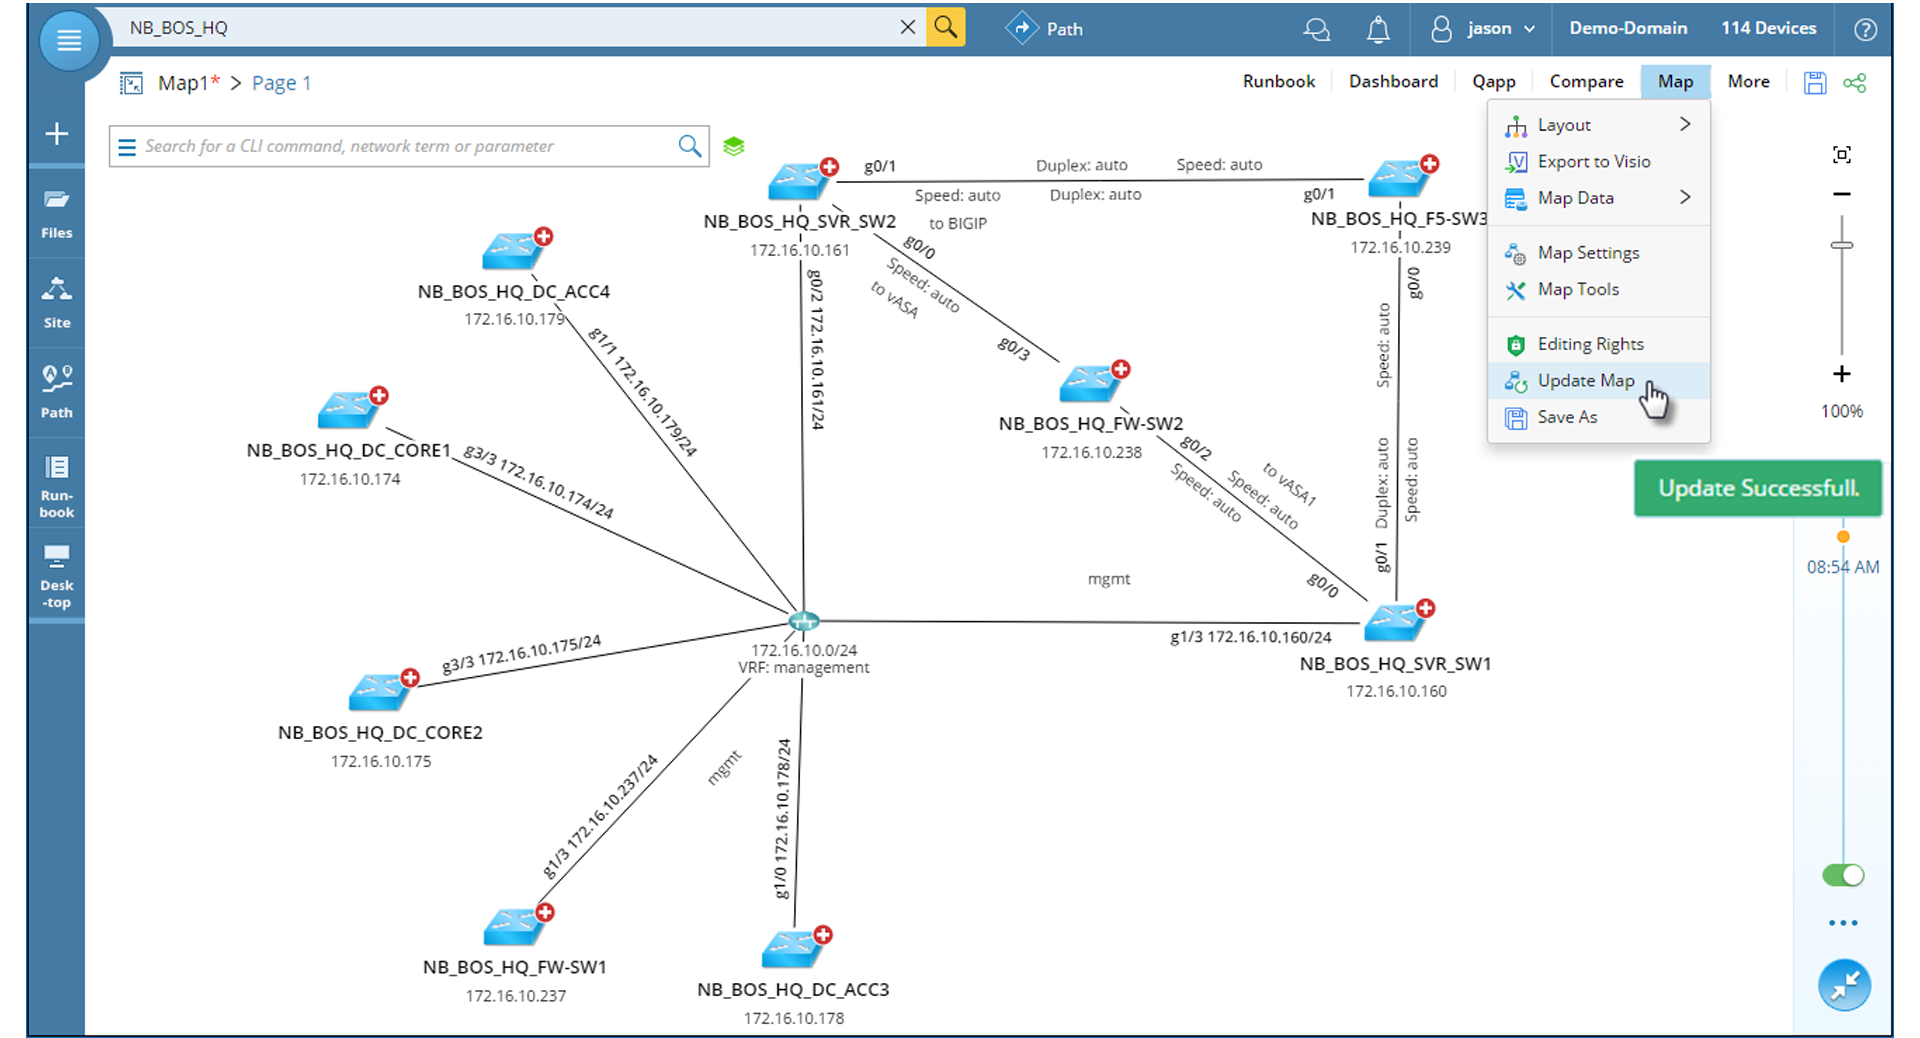
It’s the depth and breadth of data automatically collected by NetBrain that gives you a running start to troubleshoot faster. Virtually all network data can be layered onto the map (or not). Drill down into get infinite detail on topology and design data — config files, route tables, MAC, ARP, STP, BGP, OSPF, multicast, MPLS, NAT — whatever data you need to diagnose a problem is just a click away.
(In the webinar, Ray Belleville, Director of Solutions Architecture, takes you under the hood of NetBrain’s automated data-retrieval engine.)
2. Automate Diagnostic Analyses
If you’re like most network teams, troubleshooting is still a manual operation. You probably issue a bunch of CLI commands to get the information you need, try a handful of trial-and-error solutions, or — for the really tricky issues — go find your company’s resident expert (the “tribal leader”) who knows the network inside and out.
But all that takes time, and when there’s a problem, time is the one thing you don’t have.
NetBrain takes all the CLI commands you execute manually one command at a time, one device at a time, and automatically runs them across all devices in one fell swoop. Instead of painfully gathering data piecemeal and then poring over hundreds of lines of output, all you have to do is drag and drop any CLI commands onto the map. All your troubleshooting evidence is automatically collected for you — in context — right in the Dynamic Network Map.
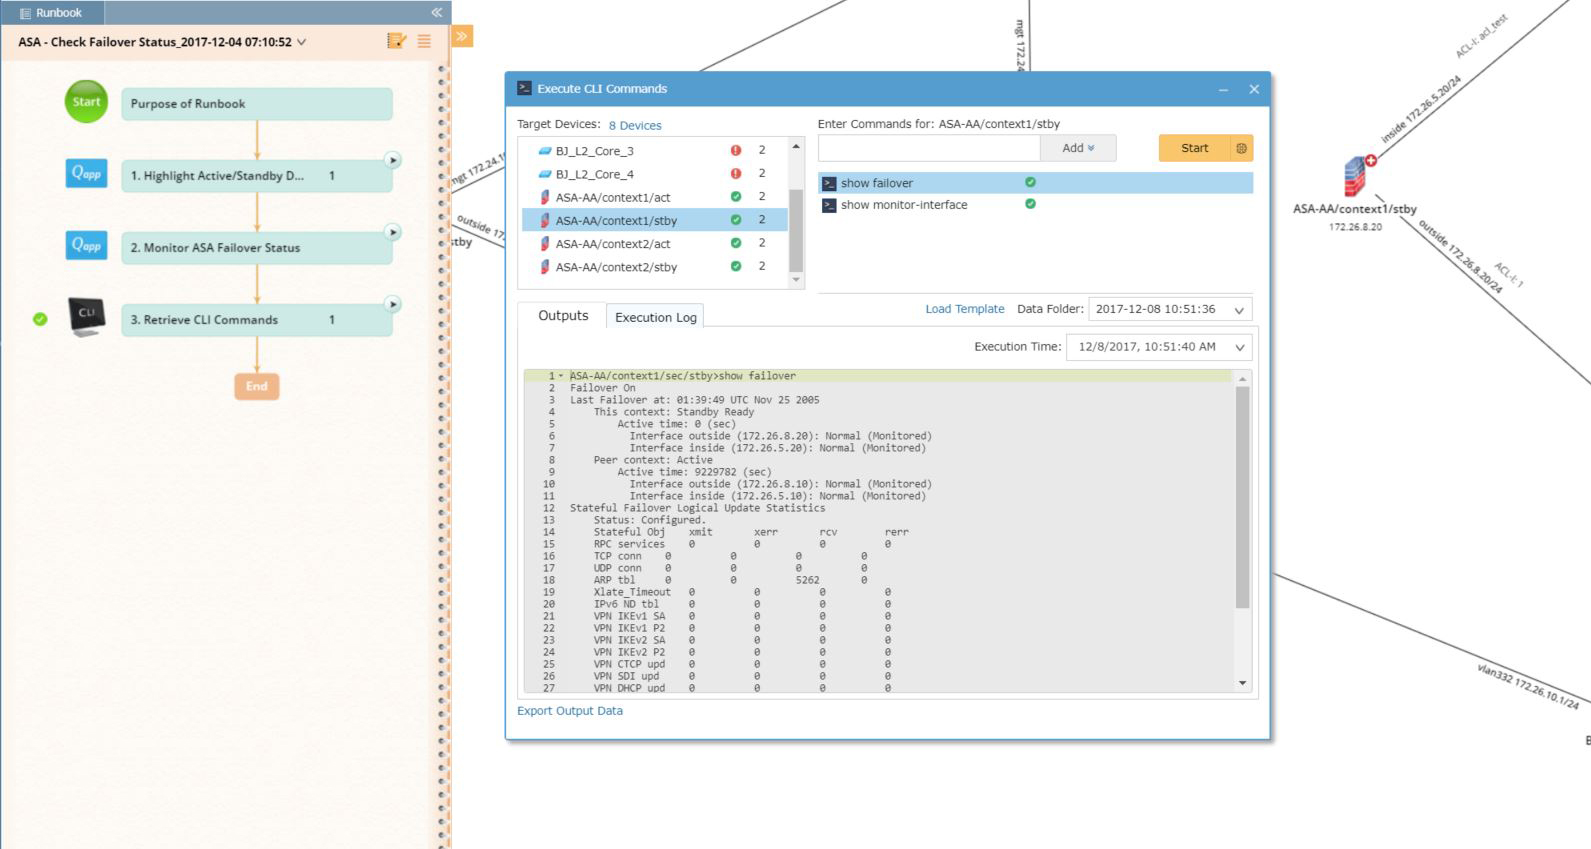
Then to analyze all the data, you can easily define thresholds — no special programming knowledge needed — to create alerts. Then it’s literally one click to turn this alert into a monitor that will flag any anomalies from then on. And even better, you can compare the current data to historical data for immediate analysis to see what’s changed.
3. Streamline Handoffs and Escalation
When every second counts, your first responders don’t have time to track down your tribal leader or thumb through a playbook binder. You want them empowered to handle as much of the troubleshooting as fast as possible. And then, if necessary, escalate the issue as efficiently as possible — without each successive team up the chain having to reinvent the wheel (perform exactly the same diagnosis the previous team did).
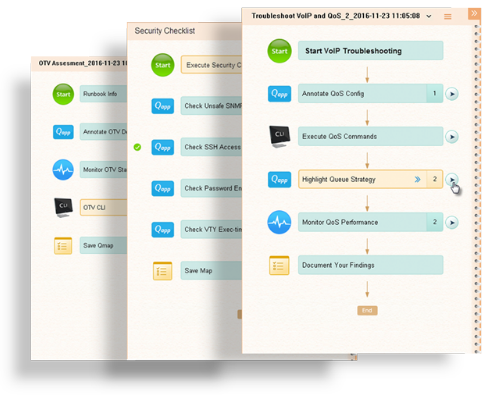
That’s where NetBrain Executable Runbooks come into play. An Executable Runbook digitizes the procedures, step-by-step, that your best expert would take to solve the problem. Each step in the runbook is an automated diagnosis made executable with the click of a button. Runbooks issue CLI commands across multiple devices simultaneously and parse through the data to display pertinent information on the map — like HSRP active/standby status, QoS queue drops, duplex mismatch, ASA failover status, and more.
A codified “if-then” workflow logic guides less experienced responders to follow a branched decision-making process, not only empowering them to tackle more issues more quickly but enabling them to escalate problems with a streamlined handoff.
4. Catch Intermittent Problems Before They Disappear
We’ve all been there: you open up a trouble ticket, but whatever circumstances caused the problem have changed, and you can only respond with NTF (no trouble found). Again, you can’t fix what you can’t see. It’s almost impossible to reproduce the problem and you have to get lucky to see it “live” in real time.
What you need is information about the problem as it occurred, not after the fact.
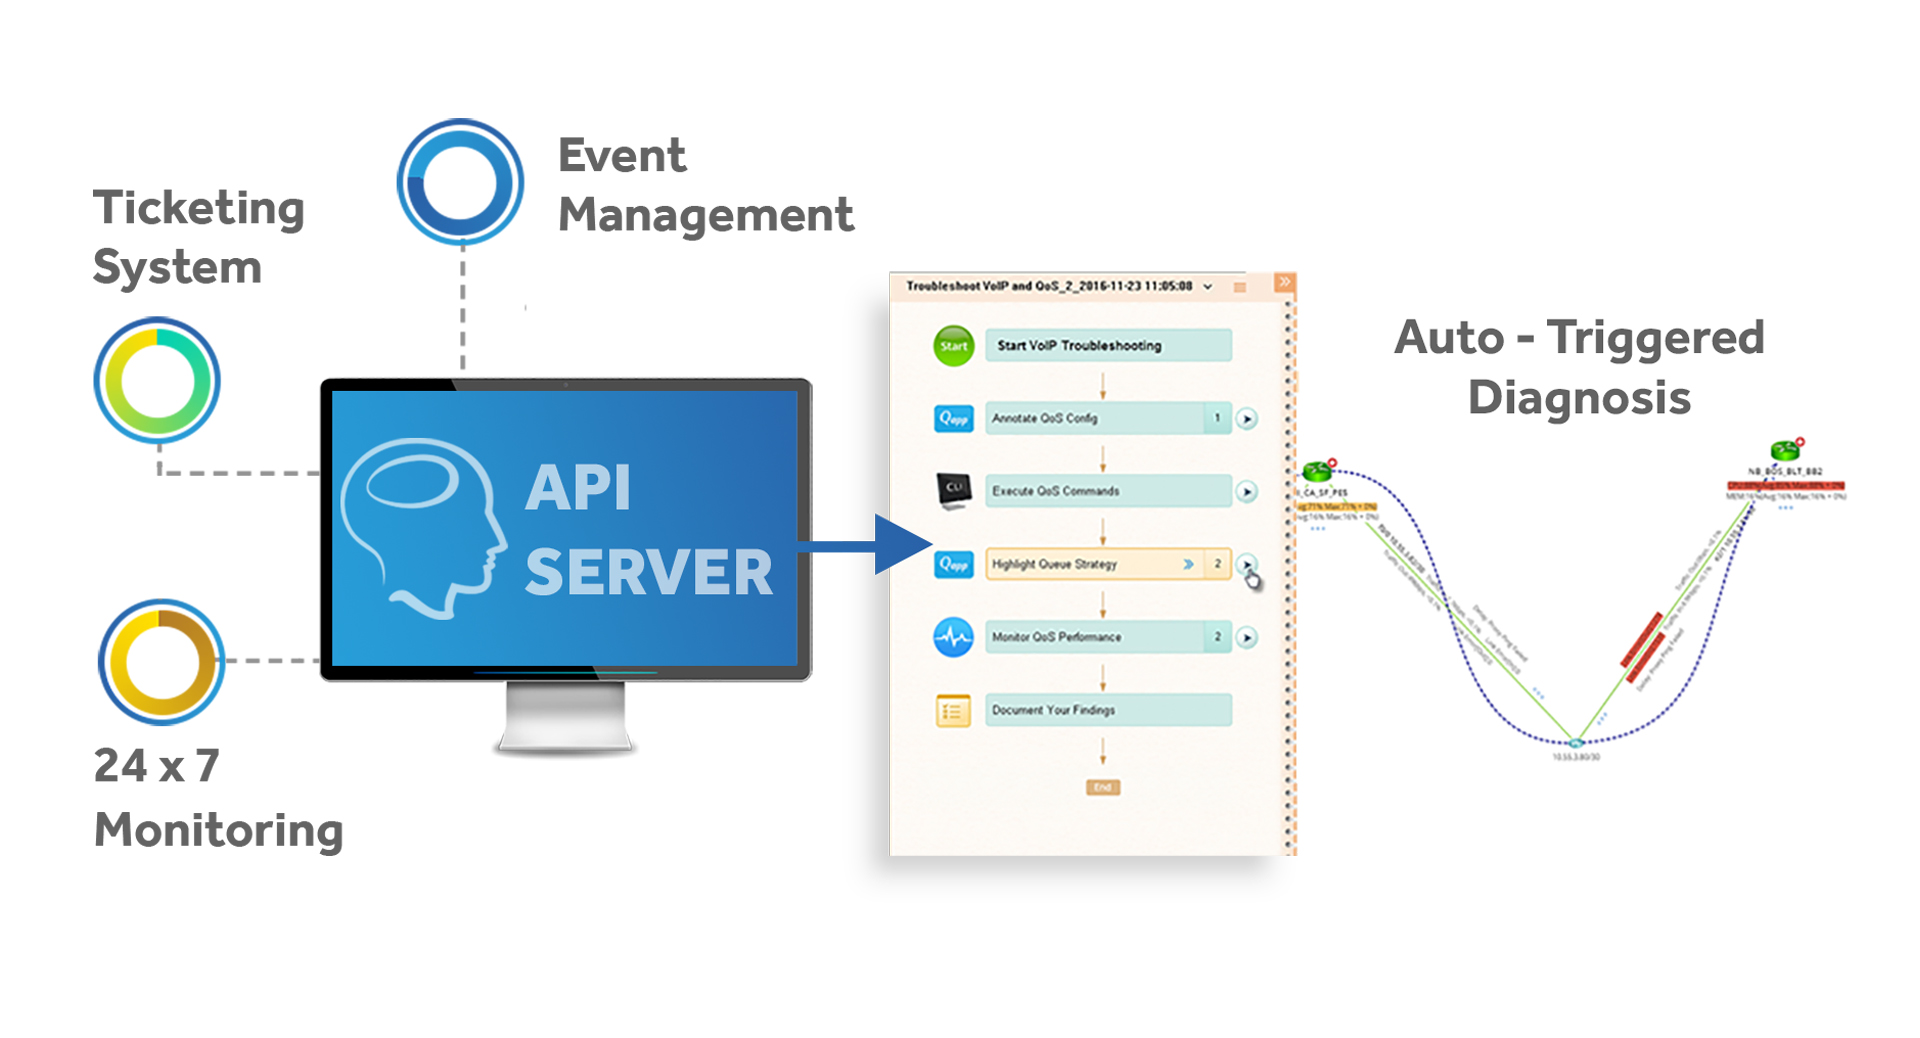
NetBrain automation is continuous. API integration with other NMS (like ticketing & monitoring systems) means that automated diagnostics and data collection are always on, so as soon as an issue is detected, NetBrain kicks in to create a Dynamic Map of the problem area and trigger an Executable Runbook to capture all the data and analyze things.
The Reduce MTTR and SLA Violations webinar is now available in its entirety on demand, no registration required.
Or an even better way to see NetBrain in action is to schedule a personalized 30-minute 1-on-1 demo with one of our experts.