 by Phillip Gervasi May 26, 2017
“It’s not the network!” If you’re like me, that’s what you proclaim when troubleshooting an application issue. The only problem: after careful network diagnosis, sometimes it really is the network.

A joke among network engineers is that when something is amiss with anything related to a computer, everyone blames the firewall. Yes, this might be funny, but it’s also one of the most frustrating things for a network engineer to do a network diagnosis. We’re good at getting pings to work across a network, but troubleshooting an application can feel like taking shots in the dark.
Only a few months ago I was tagged on an email chain started by one of our developers to help troubleshoot a legacy application used for monitoring scientific instruments. The application worked just fine at the main location, but this was a new site, and something was wrong.
I was surprised to hear that they already spent time troubleshooting the application prior to bringing me in. That was nice, but it also suggested that the problem really could be the network.
I checked the basics like access lists and MTU settings, but since the symptoms they experienced didn’t happen at the main site, I didn’t know what to look for. Both sites were configured identically, so in my mind, this should have worked. The logs for the application itself didn’t reveal anything helpful, so there was very little network diagnosis I could do except wait for it to happen again and log into devices in real time.
Capturing relevant information at the time of an incident can be extremely difficult – especially with a network of hundreds of switches and dozens of routers and firewalls. For example, tracing the layer 2 path an application takes is next to impossible because the traceroute looks only at layer 3. And even when we look at the layer 3 information for a flow, it’s in only one direction at a time.
Also, important to troubleshoot in real-time is network device information along the path such as interface errors, duplex mismatches, and CRC errors. We can get some of this by going device by device manually, but that means we’d need to be on the CLI at the ready just as a user reports an issue.
Using only the ad-hoc network diagnosis methods we had, we continued troubleshooting by taking the devices out of production in order to run tests while they were directly connected. The application worked perfectly. After putting everything back into production, it failed. To say I was frustrated would be a gross understatement.
This time I was on top of it, though, and just as the scientists began using the application again, a packet capture revealed the issue right away. The problem was so simple, but not something that occurred to me to check during network diagnosis.
I didn’t know how the application was supposed to work, and through all our conference calls I learned the developers were just doing their best to maintain an ancient program they didn’t write.
It used multicast, and no one knew.
This is where automated, intent-based network diagnosis can be a lifesaver for network engineers troubleshooting real-world problems. I had network monitors, but I needed a mechanism that could continuously monitor the network characteristics and check them against baseline configurations and be triggered by ITSM and monitoring tools to automatically capture critical information at the time of the incident in the ticket, including the network diagnosis. Luckily, I can use an intent, a no-code executable automation unit, containing steps to automatically deliver data about routing tables, interfaces statistics, ephemeral network information, and even the path an application is taking just as an incident occurs. I can even do this interactively on my own or via a self-service bot!
The main site was the only place the application was used, so this was never a thought. But now that it was being used across layer 3 boundaries to another location, the network and the application needed to have multicast properly configured for communication to work.
The remediation was relatively simple compared to the network diagnosis, and management was happy that we were able to get this ancient application working at the new site. No one questioned why it took so long, but I think that’s only because there was already an understanding that this was an old application.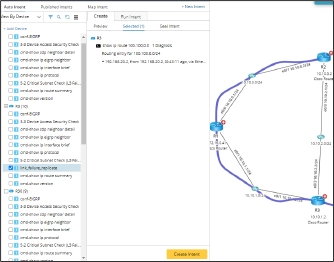
Though I shrugged off the inordinately long time to resolution, I also wished there was an easier way to capture the data I needed at the time the problem occurred. In fact, a tool like that would be priceless for troubleshooting daily network operations issues.
Smarter Network Diagnosis
NetBrain’s platform enables network engineers to easily visualize the paths applications take through our networks. Moreover, it can automatically provide the right intents to gather the incredibly valuable network diagnosis we need to address the vague trouble tickets hitting our queues that come with little to no information right on a map using Auto Intent.
In the end, fixing my application problem wasn’t rocket science. I’ve learned that many problems we face are often the result of very common issues. However, finding the problem, even if it’s simple, can be very difficult without the right tools.
Intent-Based Network Automation give us, as network engineers, the ability to create dynamic network mapping and overlay intents for real-time diagnosis and troubleshooting of the network, connectivity and application performance that ultimately help us to prove, once and for all, that it’s not the network, except, of course, when it is.