What Happens After BGP?
Gaining Full Path Visibility in Hybrid Cloud Networks In the modern enterprise, Border Gateway Protocol (BGP) plays a foundational role in connecting distributed networks. It is the routing protocol that...

I had an interesting conversation the other day with a friend, discussing his concerns about meeting stringent SLAs put in place to meet business requirements and CIO expectations. My friend works for the IT outsourcing company that manages the network infrastructure for a global company and must deal with considerable fines if SLAs are not met. The SLAs state specific service response times in regards to accepting opened tickets, responding to and resolving network issues. The outsourced IT team is also responsible for implementing infrastructure upgrades and projects without causing unplanned downtime.
Can the same old troubleshooting approach meet today’s SLAs?
SLAs are based on quick turnaround times that challenge traditional troubleshooting techniques. With the clock ticking, network engineers often must come up with a hypothesis based on limited evidence. They usually spend a considerable amount of time collecting and analyzing data just to determine a place to start troubleshooting. Without tools that automate and speed up the process, the engineer is often forced to use time-consuming manual procedures such as logging into many devices until the issue can be isolated.
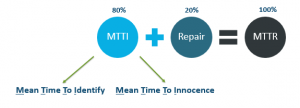 Actually resolving an issue is only 20% of troubleshooting. The other 80% is figuring out what’s causing the problem in the first place.
These same manual procedures and troubleshooting efforts can also apply to infrastructure upgrades and project implementations, especially when something goes wrong. Not only does the network team have to test complex upgrades without the necessary and expensive test lab equipment, but they also need to understand the impact of proposed changes and what could go wrong during the upgrade. Having the ability to run through different scenarios prior to the upgrade or project implementation is invaluable.
Tale from the trenches: troubleshooting vPC configuration issues by hand
During my conversation with my friend, he discussed the details of a recent switch refresh project they implemented in their data center. They were deploying multiple racks of new Cisco Nexus switches and configuring virtual port channels (vPC). A vPC allows two links connected to two different Nexus switches to appear as a single port channel to the third device. It provides many benefits; some include using all available uplink bandwidth, a loop-free topology, and no spanning tree protocol blocked ports.
On the night of the change window, the team implemented the designed solution but had limited ability to test the solution prior to implementation into the production environment. The design involved configuring a different vPC domain ID per pair of Nexus 9K switches, numerous vPCs and configuring port-channels for each pair of switches. The implementation appeared to go well, and everybody went home for the evening.
The next day they were flooded with tickets. Things that were working the day before were no longer working. Even though they knew what had changed and where to focus their efforts, because of the extent of the changes made the night before there were so many variables to look at.
The amount of manual effort required by the engineers to execute the series of commands against all the switches could take hours. NetBrain is able to optimize the entire troubleshooting workflow and complete the tasks in seconds.
This was a large data center and it involved a lot of manual troubleshooting, logging into all the new switches and executing a series of commands. They discovered several configuration issues. One pair of Nexus switches didn’t have the same vPC domain ID configured, and another pair of switches had a type-1 configuration consistency problem.
Show running-config vpc displays the running configuration for all virtual port channels. Show vpc brief displays brief information about the virtual port channel such as vPC domain ID, peer link status, and configuration consistency checks. Show vpc role displays the vPC role of the peer devices. Show vpc consistency-parameters displays the parameters that must be compatible across the virtual port channel interfaces. The key word global can be used to display all type-1 global parameters on both sides of the peer link. All type-1 configurations need to be identical on both sides of the vPC peer link or it will not come up. Show port channel summary displays information about the port channels.
Troubleshooting vPC issues with automation
Due to the complexity and the size of the network, I could see how this company could clearly benefit from applying automation to both troubleshooting and new infrastructure deployments. This one refresh project required a lot of manual troubleshooting and effort to identify the multitude of issues. NetBrain could have been used to point at a lab environment to better test the impact of the proposed changes and could have identified unforeseen issues.
NetBrain’s automation platform provides engineers with end-to-end visibility across their environments by discovering the network intelligently and through the use of Dynamic Maps. Their runbook technology accelerates troubleshooting by running actions called Qapps to find configuration problems, and the runbook works from a Dynamic Map. The amount of manual effort required by the engineers to execute the series of commands against all the switches could take hours. NetBrain is able to optimize the entire troubleshooting workflow and complete the tasks in seconds.
In the screenshot below, you can see the Dynamic Map of the network discovered and the runbook used to gather vPC configuration information.
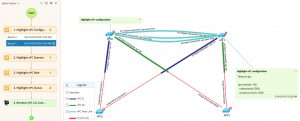 A Dynamic Map automatically retrieves and visualizes the entire vPC configuration in seconds.
Below, you see the results of one of the executed CLI commands and how easy it is to add additional CLI commands that you want to run against all switches.
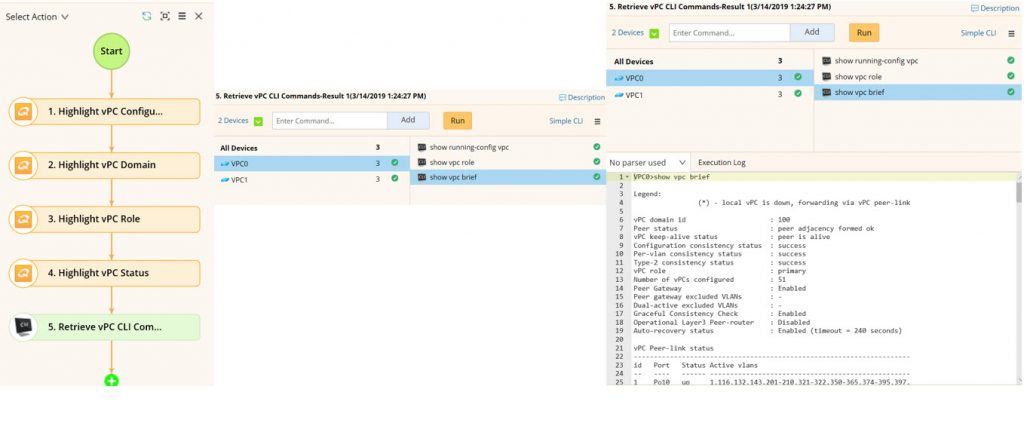 Instead of gathering CLI data one command at a time, switch by switch, you can automatically collect vPC config information instantly.
Here, vPC status results are displayed and other relevant charts can be opened to view additional information.
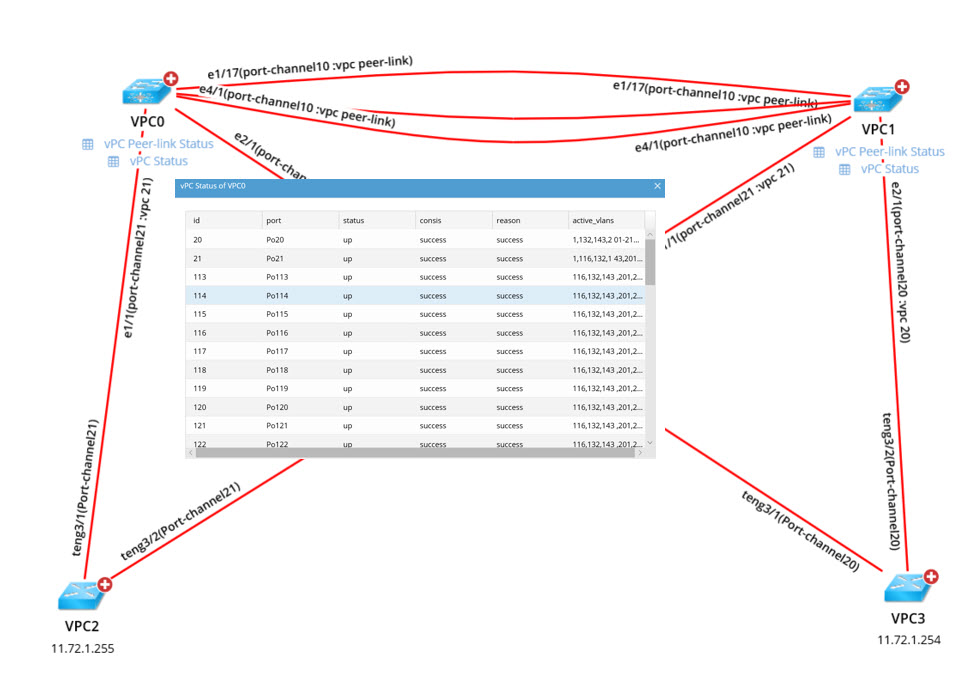 And visualize the results of automated CLI commands in context right on the map — with one-click links into other relevant data.
Conclusion
SLAs are getting increasingly tighter every day. When there’s a network issue that threatens these stringent SLAs, literally every minute counts. Yet the majority of our troubleshooting time is still spent trying to identify and isolate the issue “by hand.” There exists today an automation solution that gives you a running start into resolving the problem, a solution that delivers the deep CLI intelligence you need — only in seconds instead of hours.
Want to discover how NetBrain can be used or applied within your infrastructure? Why not take advantage of a free demo to see for yourself? So, why not start saving time, eliminating human error, and, most important, reducing the bottom line?
Also, check out these related blogs: