What Happens After BGP?
Gaining Full Path Visibility in Hybrid Cloud Networks In the modern enterprise, Border Gateway Protocol (BGP) plays a foundational role in connecting distributed networks. It is the routing protocol that...
If you’re like most network teams, SDN technology like Cisco ACI is crucial to today’s datacenters. While the business case for SDN is undeniable, the transition to an application-centric context is more of an evolution than a revolution. ACI and non-ACI environments will coexist simultaneously for the foreseeable future. Visibility into these hybrid networks is commonly not available from a single tool.
And that presents a challenge: How can you manage this heterogeneous, hybrid network as a single entity? You’ll have dozens (probably hundreds) of critical applications deployed on the ACI fabric and interconnected with the rest of your enterprise network. The ACI and non-ACI architectures together make up “the network.” They must be managed holistically, not individually. An integrated solution that gives you end-to-end visibility into the entire network — both ACI and traditional — in a consistent, unified view will ease the learning curve for your networking team, accelerate troubleshooting, and minimize downtime when things go wrong.
That’s where NetBrain for Cisco ACI comes in.
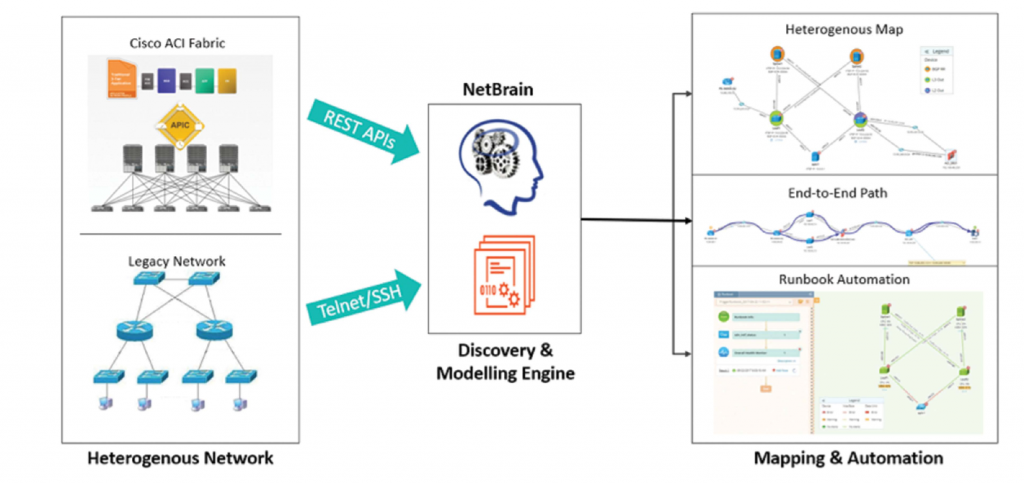
End-to-end visibility hinges entirely upon deep discovery. Through its versatile southbound interface, NetBrain talks to both ACI and non-ACI environments and hides the underlying complexities from end users.
NetBrain’s automatic discovery engine “learns” your entire infrastructure (ACI + non-ACI) and builds a mathematical model of your network, end to end, from live network data.
NetBrain discovers traditional network devices using not only SNMP but also automated CLI commands and can automatically capture the underlying design — configuration, routing, MAC/ARP tables, MPLS design, and more — via CLI. ACI devices are discovered from the APIC controller (via RESTful API integration), and ACI network data is fed into the discovery engine.
This discovery engine builds a “digital twin” of your heterogeneous infrastructure, comprising both ACI and non-ACI components. This integrated data model of your entire network is used to dynamically create data-rich network maps and serves as the foundational underpinning for automation and analytics.
The “digital twin” data model is in fact a fully searchable database. Enter any hostname, IP address, or part of a configuration file, and NetBrain builds a Dynamic Map around it. Dynamic Maps are way more than static topology diagrams — they’re loaded with information from the live network, all of it accessible with just a click or two. Three things make NetBrain’s maps “dynamic”:
It’s this dynamic nature of NetBrain maps that enables the solution to help you visualize the ACI fabric and the non-ACI infrastructure in a single, unified view.
In the NetBrain demo environment, we have a simple ACI pod with 5 components: 2 spine, 2 leaf, and an APIC controller. With just a click, we can generate a Dynamic Map of the pod.
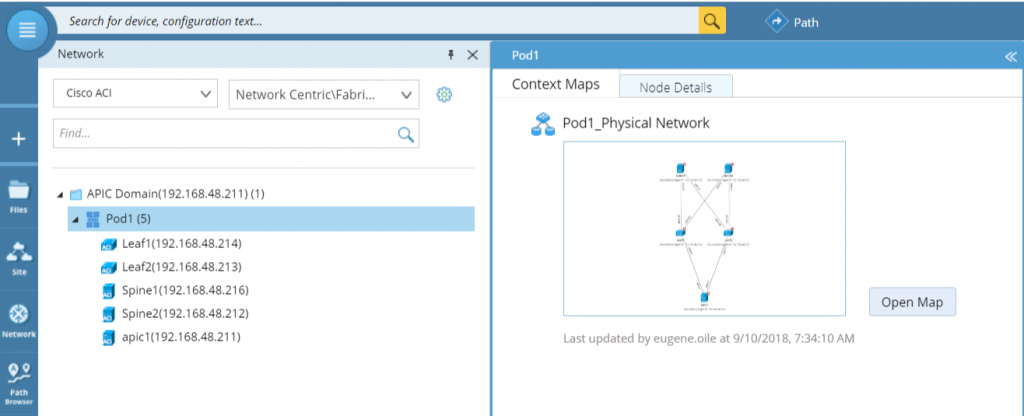 1. With just a single click, you can create a Dynamic Map of your ACI pod.
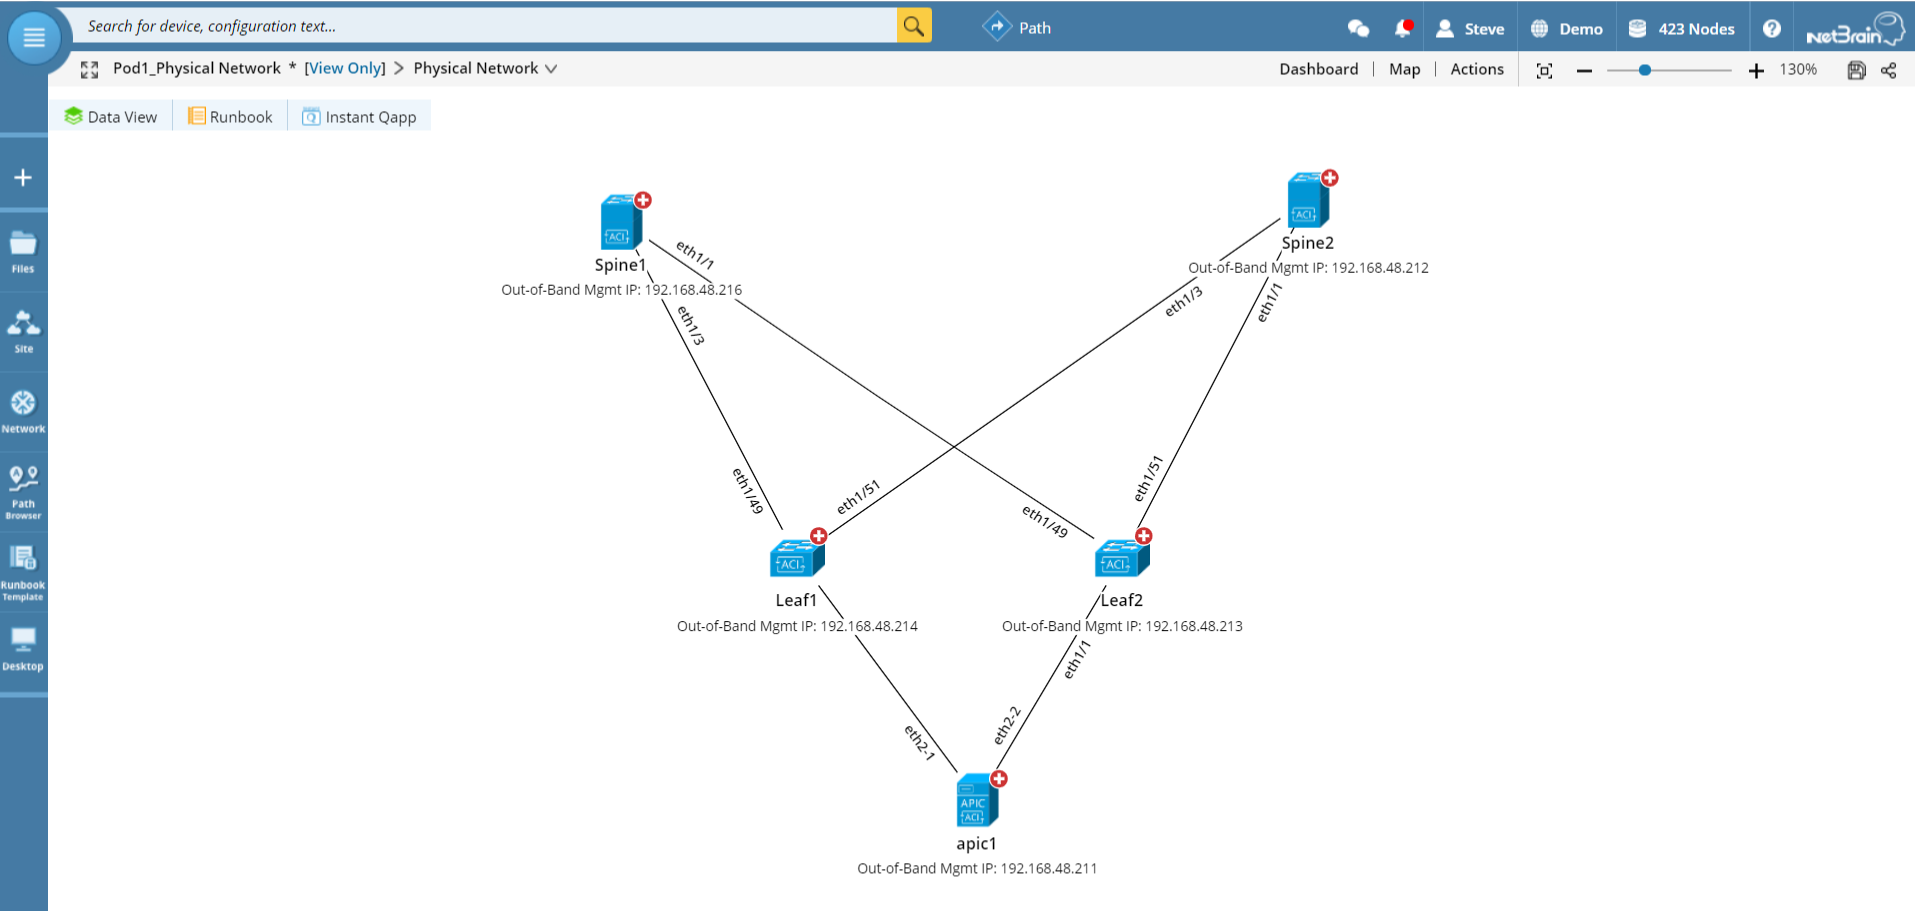 2. You see the physical topology of the ACI pod.
Now dynamically extend the L2 neighbors on Leaf2, and you see both the ACI fabric as well as its interconnections with the legacy network.
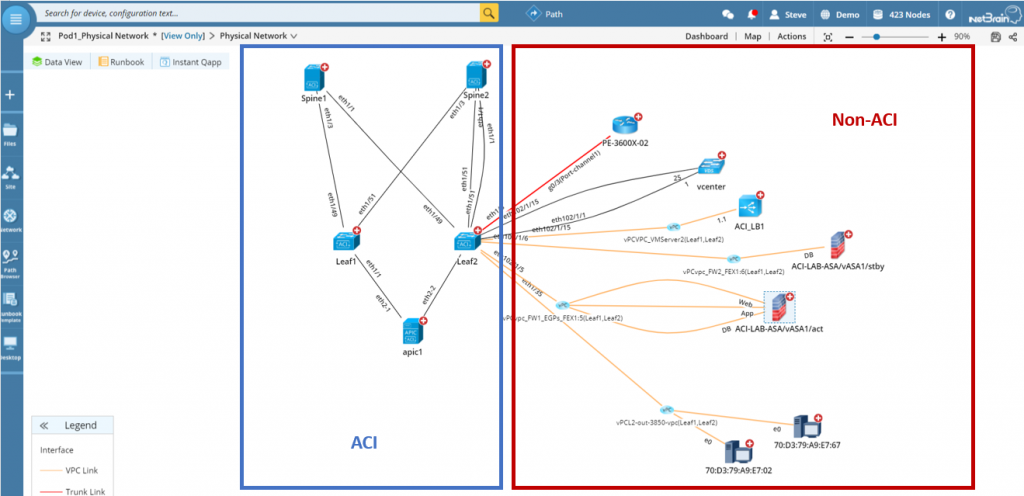 3. Now you see not only the ACI fabric but its interconnections with the rest of the traditional network — in one single Dynamic Map.
The Cisco ACI application-centric approach to data centers introduces a whole new way of looking at things. Suddenly we have to wrestle with new layers of abstraction and the new logical constructs designed to enable an application-centric data center design. Figuring out exactly what this new hybrid network looks like can mean hopping between systems, and the layers of abstraction can make it challenging for a traditional network admin to pin down an application problem. That’s exactly the problem that the NetBrain for Cisco ACI tackles.
The Dynamic Map visualization interface makes it much easier to understand the overlay/underlay designs, logic layer dependencies, and connectivity inside or outside an application. Built-in contextual maps automatically filter out the irrelevant network components and let you focus on the exact logical and underlay structure for any application and overlay construct.
Just click on the overlay map view for a pod to see the logical fabric structure, including VRFs, subnets, and the endpoint devices connected (without showing all the L2 connectivity).
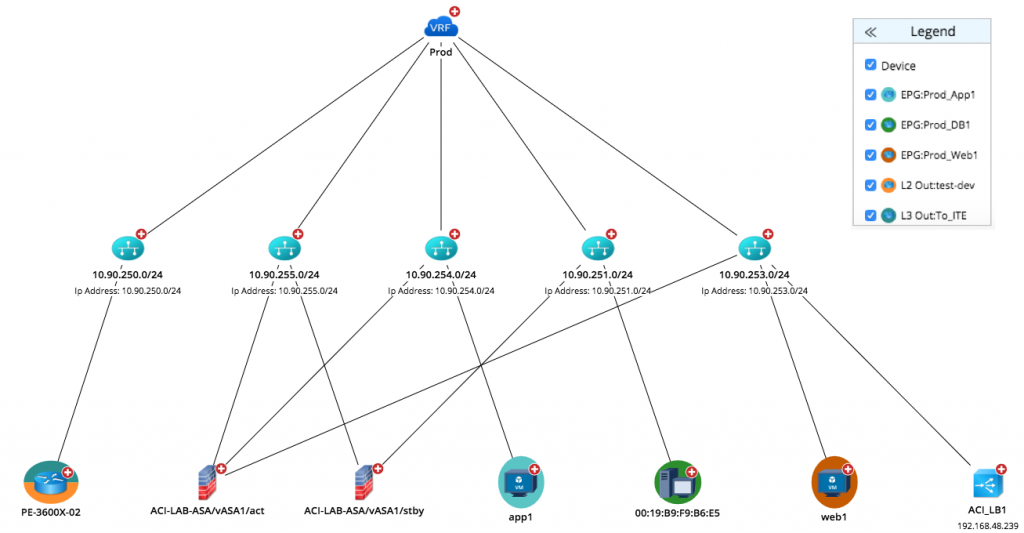 An Overlay Map view represents the logical fabric structure.
Conversely, the underlay map shows the network devices and interfaces that the overlay is built on top of, filtered for the devices carrying traffic for a particular application.
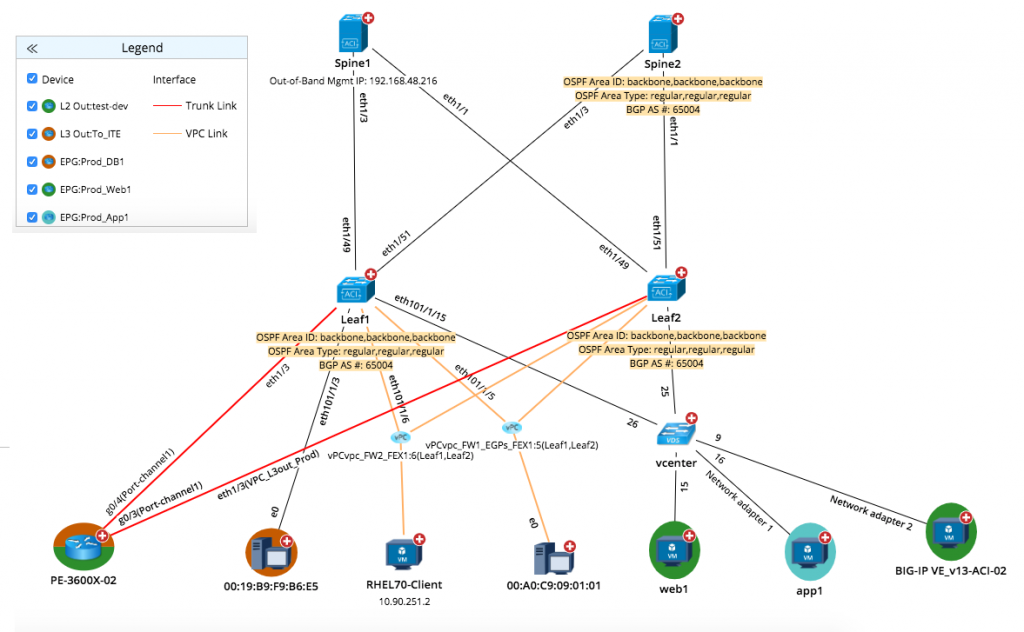 Underlay Map view shows the physical infrastructure on top of which the overlay layer runs.
And a logical structure map provides an overview of the hierarchical structure between tenant, application, endpoint group (EPG), and contracts between the EPGs.
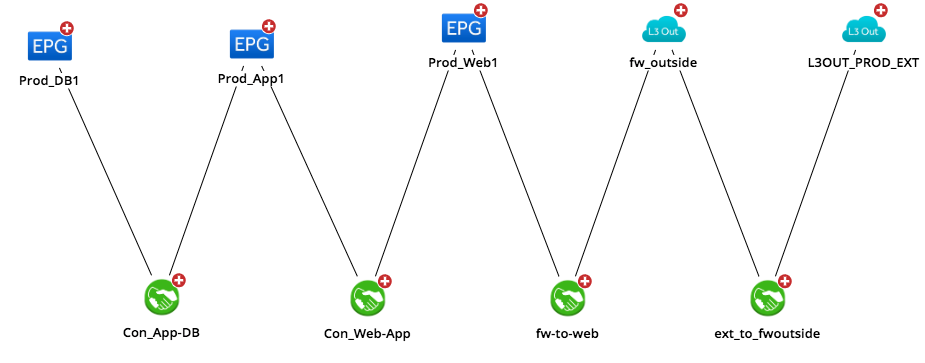 A Logical Structure Map provides an overview of the hierarchical structure between tenant, application, endpoint group (EPG), and contracts between the EPGs.
Anything you can discover manually about the network is automatically captured by NetBrain. This powerful capability is leveraged extensively in the joint solution. All your device, topology, design, configuration, routing, etc., data is embedded within the Dynamic Map.
Basically, Dynamic Maps document your network automatically. And because Dynamic Maps are built from live network data, they’re always accurate, always up to date. Further, data from other systems can also be made available via RESTful API integration, and shown in context on the map. More than a dashboard, a Dynamic Map is an interactive “single pane of glass” where you can actually execute whatever task is at hand.
So how does NetBrain include all this rich data in a Dynamic Map without it becoming a cluttered mess?
A feature called Data View organizes and displays various network information via “data containers” that allow you to toggle on or off layers of device data. These views show you infrastructure, maintenance, and design information for each device across the heterogeneous network from different perspectives. All the various Data Views that are relevant for the devices on the current map are listed in a “table of contents” drop-down menu.
Data Views may decode design for a particular protocol (BGP, OSPF, multicast, etc.) or show performance metrics or display third-party system information (ServiceNow tickets, Splunk data, 24×7 monitoring details — even Cisco TAC recommended remediation actions).
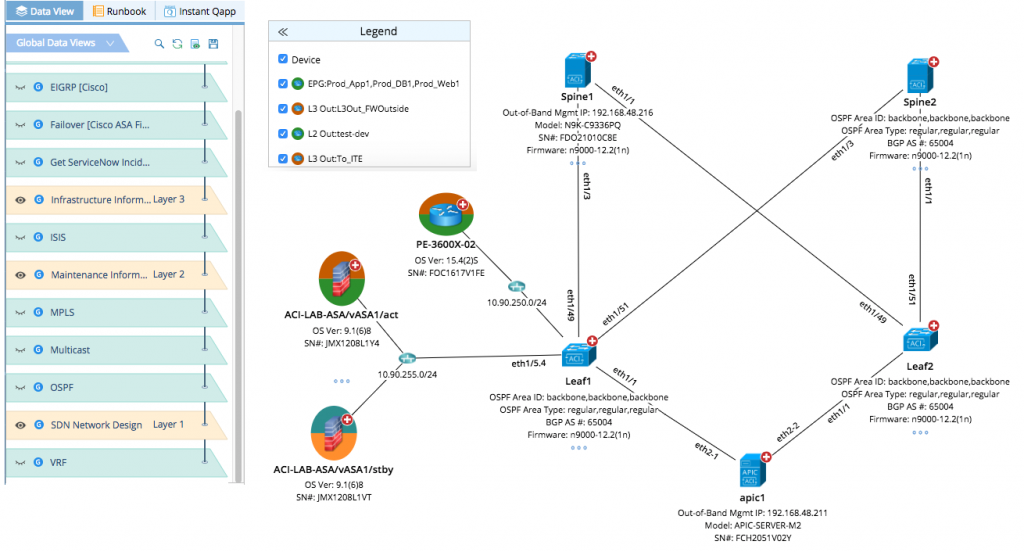 Data Views give you one-click access to the data you need, when you need it, on a single pane of glass.
When you’re troubleshooting a slow application in a hybrid environment, most apps will be traversing both the ACI fabric as well as the non-ACI network. You’ll have a ton of applications running on top of the same infrastructure — which makes visualizing the application flow from both a physical and logical perspective crucial. The solution leverages NetBrain’s A/B Path Calculator that dynamically maps the flow of any app end to end, no matter where it goes.
NetBrain emulates real packet forwarding to analyze how traffic flows across the network, taking into consideration deep network protocol analysis such as routing, ACLs, PBR, NAT, and VRF.
All you have to do is specify a source and destination address, and NetBrain does the rest.
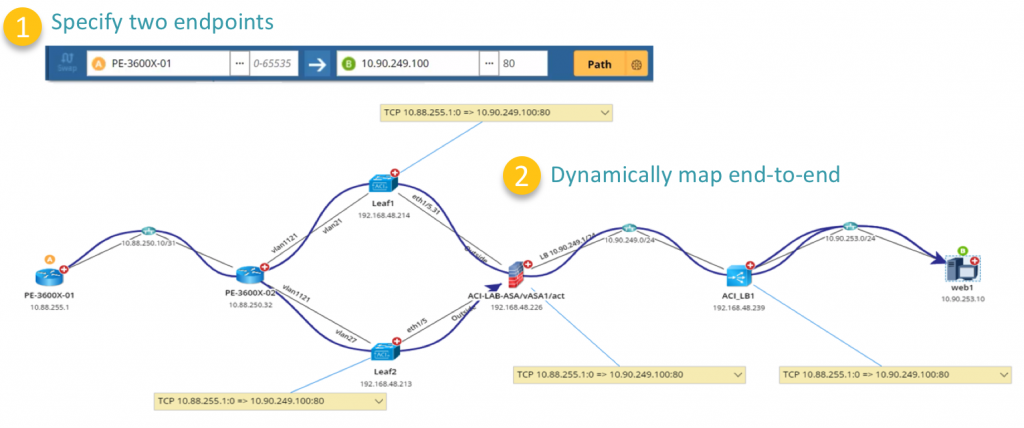
NetBrain’s A/B Path Calculator dynamically analyzes app traffic flowing through bot ACI and non-ACI environments.
NetBrain’s API integration with the APIC controller means you can automatically trigger a troubleshooting diagnosis the moment a problem is detected. As soon as the APIC controller picks up an event (say, an interface status change), NetBrain automatically (1) maps the problem area and (2) kicks off a sequence of pre-defined (yet customizable) diagnostic steps to capture all the data and analytics about the event in real time.
We call this “just in time” automation because as the event is happening, all the data about the problem is automatically collected, analyzed, and saved in context on a Dynamic Map. No human involvement is needed. When you go to troubleshoot the issue, you have a running head start because all the diagnostic results are right there in the Dynamic Map, waiting for you.
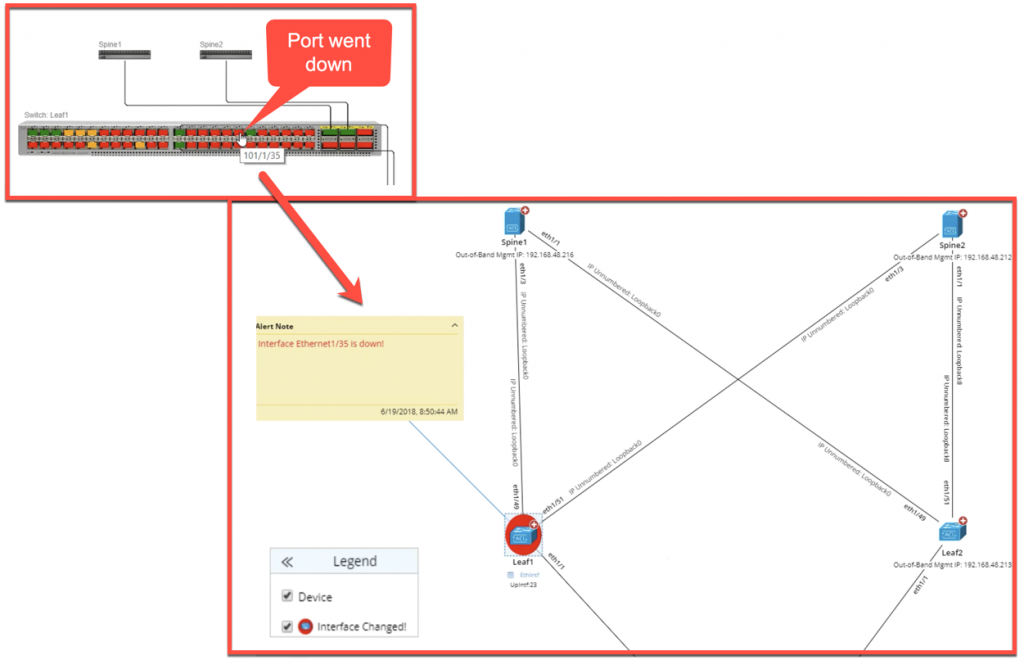 NetBrain’s “just in time” automation diagnoses issues at the time of the incident — you don’t even have to be around.
Making the transition to an application-driven way of doing things is no small feat. First, we must develop an application-centric mindset to understand our new software-defined architectures and further manage them effectively. Second, we need to understand how it connects to the rest of the traditional network. Without effective tooling support, the task of managing such an evolving heterogeneous network has proven to be very challenging.
NetBrain for Cisco ACI helps address these challenges by leveraging automation to provide end-to-end holistic visibility into the entire hybrid environment. And that means we can manage our network as a single system from a single Dynamic Map interface — using the same tools to understand and manage the hybrid ACI/non-ACI network in a consistent manner.