Transforming NetOps Workflows From Manual to Automated with Agentic AI
Staying ahead of problems is crucial in today’s fast-paced IT environment, and integrating automation and AI into Network Operations (NetOps) workflows plays a vital role in achieving this. By adopting “Shift Left” methodologies, organizations can proactively tackle challenges in troubleshooting and change management, enabling automated workflows. By feeding human knowledge back into the platform, proactive assessment and holistic observability become a reality. AI becomes smarter. Embracing a platform approach empowers operations teams to streamline workflows and enhance network resilience.
Shift Left Network Operations Workflows
• Troubleshooting – AI-driven ticket triggered auto-diagnosis execution and result generation
• Change – Auto-remediation for change with pre-built runbooks
• Observability – Enforce network with past outages observability dashboard with alerting
Systematically Shift Left Four Workflows
Fusion of AI and Automation
By integrating Automation and AI into your NetOps workflows, you can seamlessly ‘Shift Left’ operations to enhance efficiency and responsiveness. Explore the capabilities of AI and automation to discover the specific tasks it can perform, streamlining your operations and allowing your team to focus on higher-level strategic initiatives.
AI That Works Alongside Your Network Team
Two Powerful Modes for Smarter Operations
1. AI Co-Pilot: Your Action-Oriented Assistant
For teams who need answers that lead to immediate solutions
What it does: Executes tasks based on natural language requests
Powered by: Your existing automation library + custom-built workflows
Use when you need to:
▶ Automate troubleshooting steps (“Check interface status every 5 minutes”)
▶ Run predefined diagnostics (“Draw path between these IPs”)
▶ Implement quick fixes (“Roll back last ACL change on FW01”)
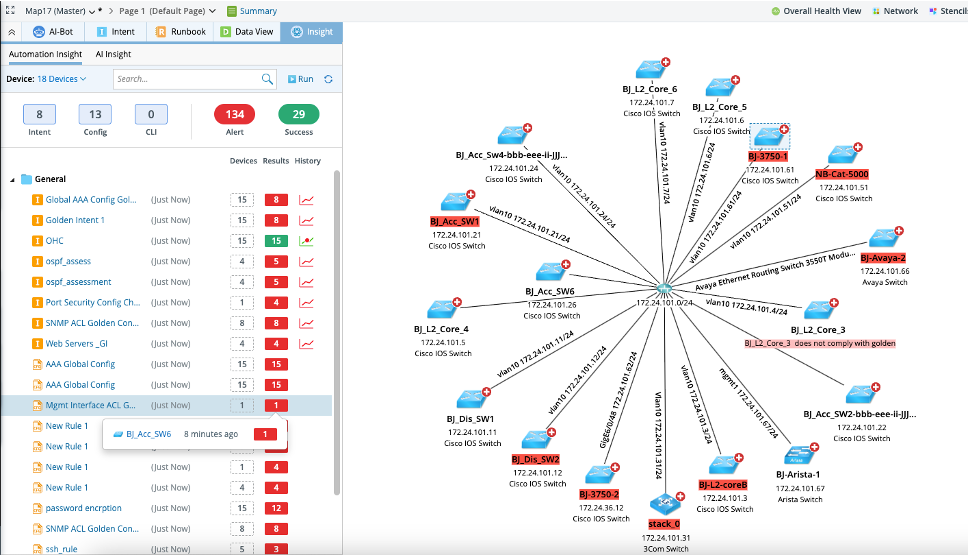
2. AI Insights: Your Proactive Network Analyst

For uncovering hidden risks and root causes
What it does: Analyzes network behavior to surface critical findings
Powered by: Extensive baseline database + behavioral learning
Use when you need to:
▶ Explain intermittent issues (“Why is port 443 traffic being blocked?”)
▶ Detect configuration drift (“Show me unauthorized BGP changes”)
▶ Receive remediation advice (“ACL rule modified yesterday is causing packet loss”)
How It Works Together
Scenario: Interface flapping alert
→ AI Insights detects the pattern and identifies probable causes
→ AI Co-Pilot executes verification checks and implements fixes
Technical Depth Where You Need It:
• Processes natural language queries into executable automation
• Correlates live data with historical baselines
• Explains findings in both technical and business terms
Why Teams Choose This Approach
AI Co-Pilot
▶ Best For “Do this now” tasks
▶ Data Source Your automation library
▶ Output Completed actions
▶ Example “Schedule interface monitoring”
AI Insights
▶ Best For “Explain this” analysis
▶ Data Source Crowdsourced intelligence
▶ Output Actionable findings
▶ Example “Policy change caused 443 blockage”
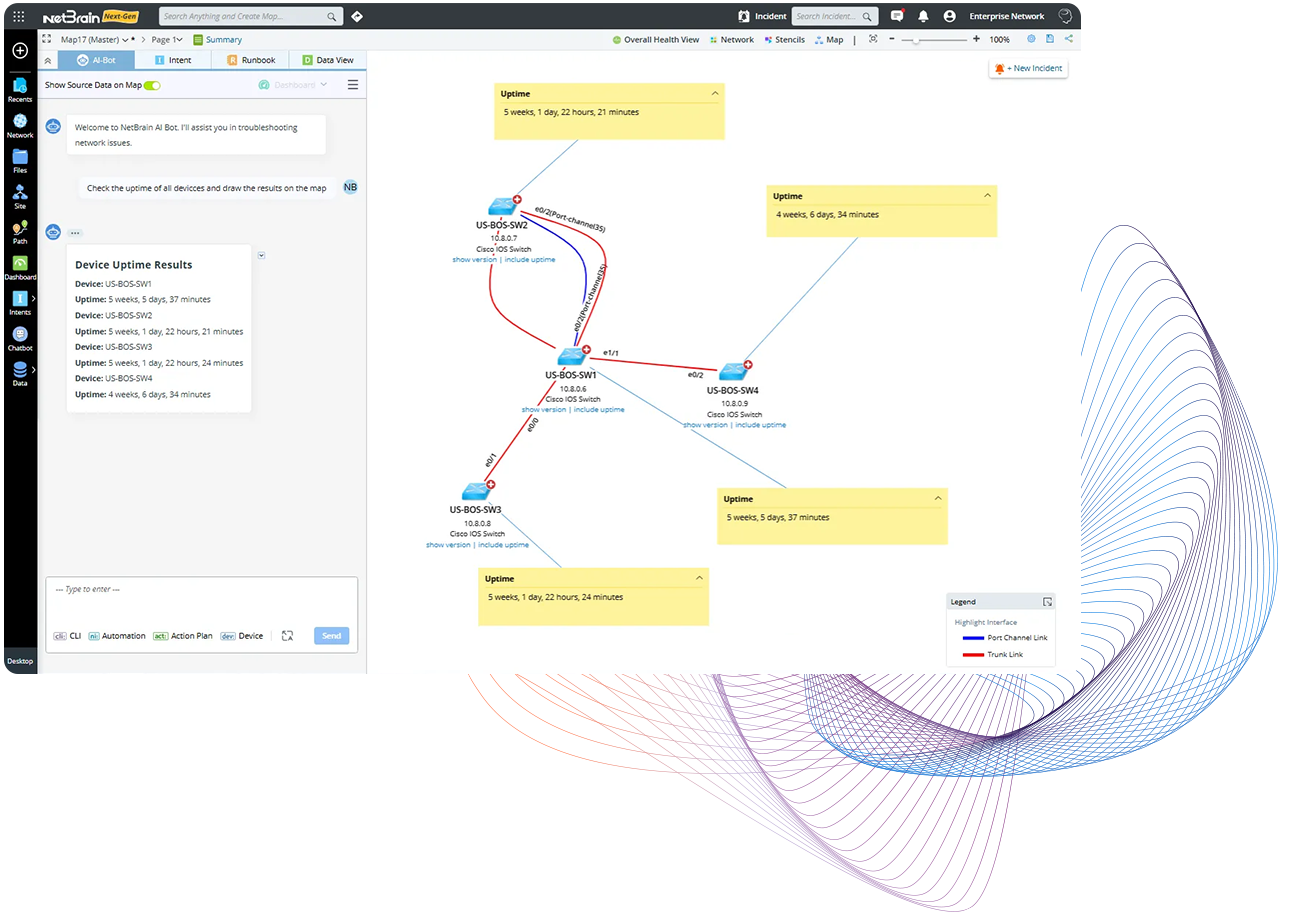
NetBrain’s Co-Pilot with Agentic AI uses a LLM to understand the context from your plain language input to trigger the right agents. These agents are functions that call the correct internal APIs to get each task done. This makes troubleshooting and automation much more efficient.
What automation can you ask NetBrain AI Bot to perform?
Use Cases for NetBrain Bot
IP Lookup
1. Translate IP to device and interface if matched
2. Translate to 1st hop L3 Gateway and L2 Gateway (One-IP Table Lookup)
3. Same Subnet Device
DNS Lookup
Translate a DNS name to an IP
Neighbor Lookup
Lookup a devices neighbor(L2, L3, IPv6)
Digital Twin Database Lookup
Query NetBrain database for data fields with reasoning
Automation Data Table Lookup
Lookup data stored in an ADT
Issue CLI Command and analyze results
Execute Network Intent for scheduled or immediate action
Run steps to troubleshoot BGP on a core router
Check the uptime of all devices and draw on mapped devices
Check all devices on map for logs with the word “error” and summarize results
Check Config Drift by Device on devices on the map and summarize results in a table form by device and result
Investigate for software vulnerabilities in my network. Take the devices on the map and list the software versions
Assess the Network Observability for CVE Security on devices present on the map -> based on Automation/Observability/ Observability
For CVE Security Output = NI results
Now run $intent on map devices and display results in a dashboard with the dashboard group “check CVE vulnerabilities
Before a change, capture the routing summary state for devices on the map using the “show IP route summary” CLI command. Print the results in a table and record the state for comparison with post-change data omitting “Replicates”, “Overhead”, “Memory”, “NHRP” and “internal” from the output.
Issue command “show version” on devices on a map, find uptime, version, reboot reason, then draw result output on a map. Also, print results in a tabular format and highlight any device that has rebooted in the last 24 hours.
Get device details from devices on the map
Check and summarize QoS drops on the devices on the map
Draw device, note, arrow on map with the output data
Benefits of AI-Driven Network Automation with NetBrain AI Bot
- Natural Language Automation Integration: Query, interpret, and summarize results in natural language.
- Repeatable Workflows: Orchestrates pre-built playbooks, called action plans, based on previous experiences and past outages and reuses them consistently to generate repeatable, predictable results.
- Built-In Intelligent CLI: Execute CLI Commands with AI Intelligence.
- Accurate Data Retrieval: Dynamically get inventory from the live Digital Twin and stored device data.
- Full Visibility: Draw devices, neighbor relationships, features, and application paths on any map.
- User-Friendly Troubleshooting: Reduce MTTI/MTTR and shift troubleshooting left.
- Safer Change Management: Perform pre and post-checks and monitor critical systems while implementing the change.
- Actionable Observability: Export results of intent-driven automation to observability dashboards for diagnostic assessment sharing and archival.
- Predictive Analysis: Analyze historical data and network behavior to predict the potential impact of changes. By identifying risks early, you can help prevent outages and performance issues.
- Enhanced Compliance and Reporting: Ensure all changes adhere to policy and compliance requirements.
