What Happens After BGP?
Gaining Full Path Visibility in Hybrid Cloud Networks In the modern enterprise, Border Gateway Protocol (BGP) plays a foundational role in connecting distributed networks. It is the routing protocol that...

Effective 24/7 network monitoring is the foundation for maintaining network reliability and performance. While continuous monitoring tools excel at detecting anomalies and triggering alerts, investigations are usually manual and time-intensive, slowing down incident response. The lack of context and visualization forces engineers to piece together data from multiple sources, delaying root cause analysis and resolution.
NetBrain enhances traditional network monitoring by providing dynamic, real-time visualization of network topology alongside automated workflows. NetBrain streamlines troubleshooting, reduces manual effort, and accelerates incident resolution by contextualizing alerts within live network maps.
Traditional 24/7 monitoring solutions, such as SevOne, Solarwinds, NetScout, or ExtraHop, monitor the network for many symptoms. They provide network teams with alerts when conditions deviate from baseline network traffic. These alerts can consist of a down interface, high bandwidth utilization, packet loss, and more.
One of the strengths of these tools is the ability to allow users to identify what they want to be alerted to from a wide range of metrics that transcend network performance, including:
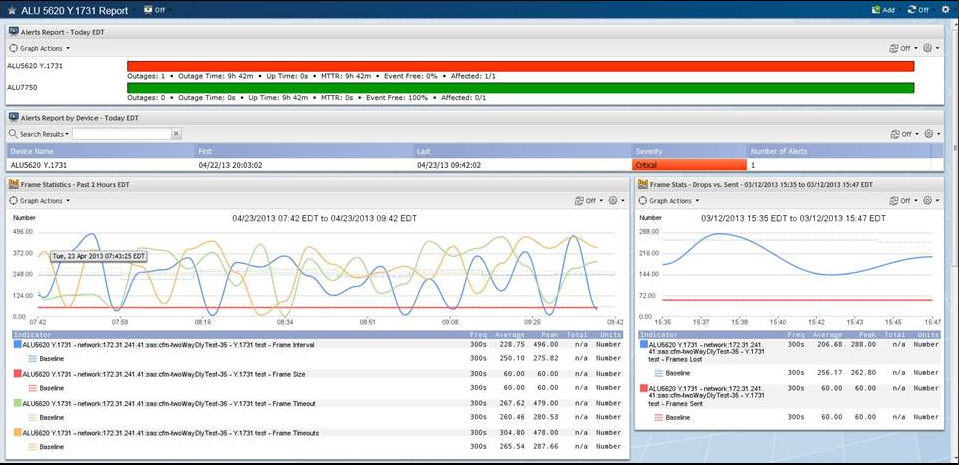
Example of network monitoring dashboard: Network Monitoring Solutions provide users with predictive alerts when conditions deviate from baseline network traffic.
Network monitoring solutions let you know there’s a problem via dashboards, but some fail to deliver the level of detail needed for subsequent troubleshooting. Here’s how these tools fall short:
While most tools do a solid job of detecting anomalies and generating alerts, optimizing your network monitoring system requires you to:
Today, following an alert from a monitoring solution, your team usually performs manual data collection and analysis, box-by-box, through the command line interface (CLI). However, finding the source of the problem is usually the hardest but most crucial part of troubleshooting a network problem. With NetBrain, once the alert is received, you can quickly understand the impacted area with a detailed, layered visualization of diagnostic data.
NetBrain helps you to visualize the results of its own diagnostics and data from the monitoring solution and other tools you may be using. It contextualizes the problem on a Dynamic Map.
For example, an alert is received about a critical application running slowly. With NetBrain, you can instantly generate a map of the application path from just the user’s IP address and the IP address of the application’s server. To build the map, the system looks at live network data like routing tables, NAT, policy-based routing, access lists, VRFs, etc.
The map is specific and includes data in context, and since it only took a few seconds to create, it probably saved hours of time. Now you can get to solving the problem instead of just trying to find it.
From the map, you can run automated applications that pull relevant data from all devices along the path — memory and CPU utilization, interface issues such as collisions, CRC errors and more — to drill into what could be causing the problem. You can automate virtually any repetitive, time-consuming data collection and analysis task in an Executable Runbook — a series of predefined, automatically executed workflow steps.
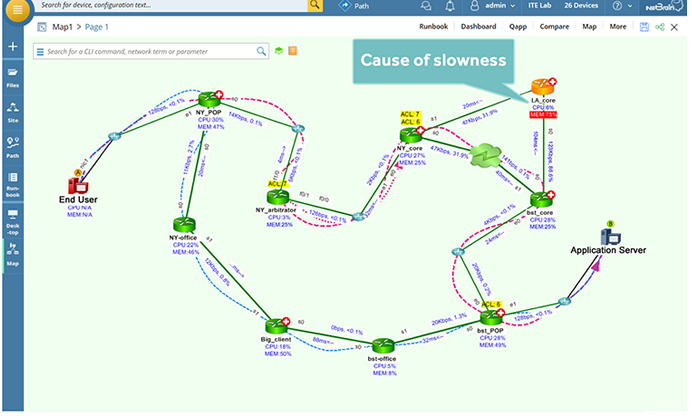
Visualize and analyze a slow application path to pinpoint root-cause problems — here, an overutilized router due to asymmetric application traffic paths.
NetBrain customers typically see the most value by integrating NetBrain with their existing network monitoring solutions. This helps them to achieve “just in time” automation and address the challenges of manual troubleshooting once an alert is reported. Integration also enables enhanced visualization of the problem area and the ability to monitor for specific problems, instead of symptoms, in the future.
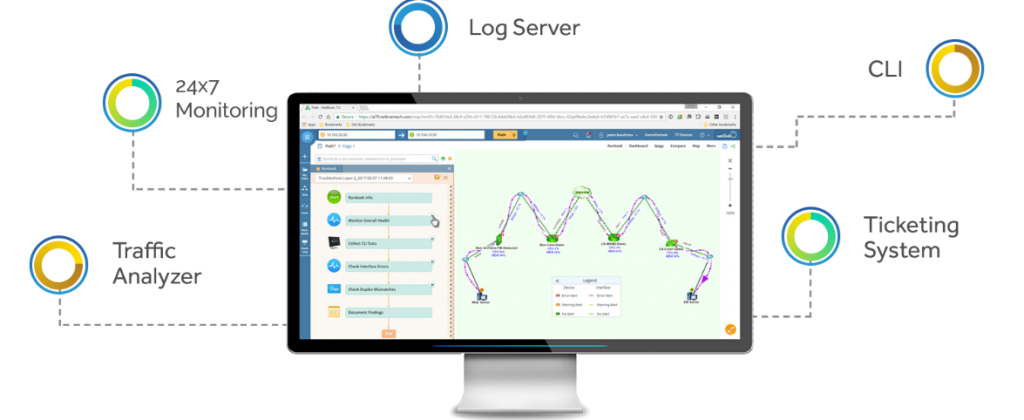
NetBrain can integrate with other tools via RESTful API. This integration layers data from various sources, including data from virtually any monitoring solution, onto a Dynamic Map. This makes NetBrain a modern user interface for effective troubleshooting and network management.
Let’s say that an alert is raised by your monitoring system:
This single pane of glass is presented to you regardless of your network infrastructure. NetBrain brings unprecedented visibility into traditional, virtualized, hybrid, and SDN environments, which reduces troubleshooting time and helps your team to easily execute many network-related tasks. In this troubleshooting case, the tasks can be accomplished without the “swivel-chair” approach that forces engineers to hop from tool to tool, losing context.
A Dynamic Map is the modern User Interface that offers a true single pane of glass experience.
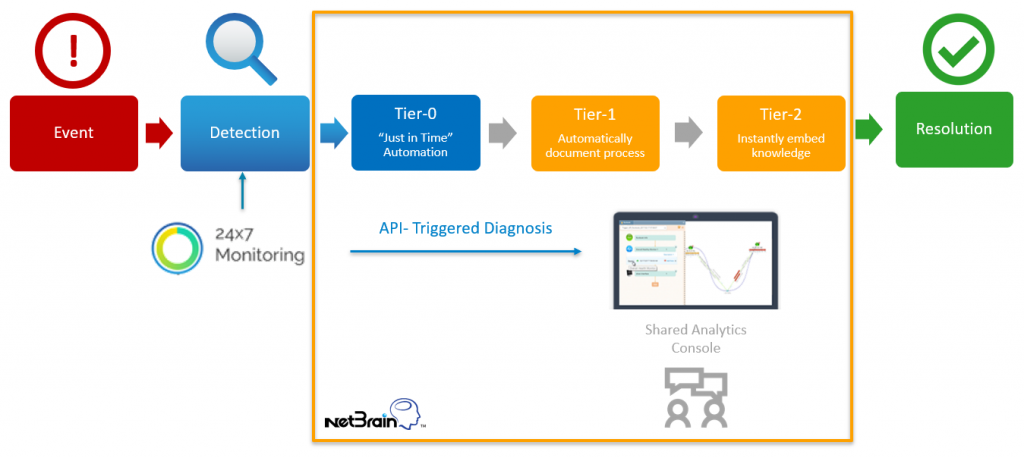
Imagine if all this visualization and diagnosis occurred automatically as soon as an alert is detected? By integrating NetBrain with your 24/7 monitoring solution, you can configure this to happen automatically.
You can configure your monitoring system to launch a NetBrain diagnosis the moment an alert is triggered. NetBrain will immediately generate a dynamic map around the affected device and gather diagnostic data in real time. This kind of event-based automation — known as just-in-time automation — runs as the issue unfolds, usually before your team begins investigating.
This just-in-time automation provides real-time visibility and diagnostics from the moment the incident occurred. This data visualization informs your team on how to respond quickly, saving critical time otherwise spent collecting and analyzing data. NetBrain can provide you with instant access to a Dynamic Map of the problem area and Runbook data, which provides actionable insights. This is the most effective way to tackle those (increasingly commonplace) intermittent problems that seem to have disappeared into thin air before they’re found.
Organizations typically see the most value by integrating NetBrain with their existing network monitoring solutions.
Once the problem is resolved, it’s easy to move on to the next issue. But, taking a minute to schedule NetBrain to continuously monitor for this underlying problem gives you the peace of mind that this problem will not be a recurring nuisance. NetBrain Qapp Scheduler can automate the next best steps you took to resolve issues when you became aware of the problem the first time, instead of waiting for an alert about the same issue again.
For example, say the monitoring system detected high utilization on a link between the data center and the headquarters office. The alert was raised promptly, but you still do not know why there is a high utilization on this link. Fact-finding will take time. After troubleshooting, you determine that a firewall failed in the data center. The backup kicked in properly, but it was not configured the same as the primary, and it couldn’t handle the high bandwidth demands.
Your team is concerned about similar problems elsewhere in the network. To uncover them, your team must inspect all the configs in the backup firewalls, which could take a long time, depending on how many of these firewalls are in the network.
NetBrain Qapp can automate this task and inspect all of the configurations on the backup firewalls. NetBrain can now automatically compare configs between Active & Standby firewalls periodically, as your team specifies, effectively monitoring for this problem in the future.

NetBrain monitors the network for underlying problems like comparing configs between Active and Standby firewalls. The user can schedule a Qapp to run every 10 minutes, for example, and alert on defined parameters.
Your 24/7 network monitoring is only as effective as the context and automation behind it. NetBrain enhances your existing tools by visualizing issues in real time and automating responses when they’re needed. Empower your team to reduce manual effort and accelerate troubleshooting with NetBrain.
Schedule a demo today and see what NetBrain can do for your network monitoring.