DORA: What Financial IT Must Know
The Digital Operational Resilience Act (DORA) entered into application across the European Union on 17 January 2025, reshaping how financial institutions manage cyber and operational risk [1]. Although the United...

What has changed in my network? Seems like a very basic question, but most of the network administrators I speak have no visibility into network changes.
Networks have never been so complex to manage as today. To address this challenge, IT organizations have deployed tools that collect a myriad of data, can draw nice graphs, and create colorful dashboards but a lot of the time cannot answer the basic questions “What is normal? Is there anything abnormal happening on my network? And if yes, what?”
![]() When an incident hits the network, these are the first questions that admins ask themselves. And even if they did not make any network changes on the part of the network they control, they might be impacted by network changes or other factors not under their control, i.e., changes at the provider, HSRP Failover, weather impact on a radio link, bug in a new software. . . .
When an incident hits the network, these are the first questions that admins ask themselves. And even if they did not make any network changes on the part of the network they control, they might be impacted by network changes or other factors not under their control, i.e., changes at the provider, HSRP Failover, weather impact on a radio link, bug in a new software. . . .
This is why they need a way to set up a baseline representing the healthy, normal state of the network. And based on that, get a fast understanding of any deviation on the key operational data.
That’s why NetBrain developed its Golden Baseline functionality powered by AI, enhancing the Dynamic Map. This is the reference standard of a “healthy” network in the context of various data types. It can be further used as a foundation for network management analysis and troubleshooting.
Golden Baseline regularly collects live data to baseline topology, paths, device groups, sites, or MPLS Virtual Route tables.
Let’s illustrate with two examples.
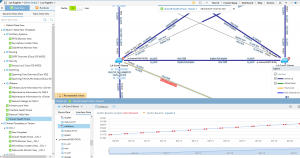
We have flapping routes with OSPF. To be proactively alerted on this incident, we can set a threshold with a normal number of routes and get alarmed for any deviation.
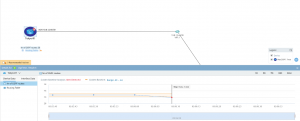
Golden Baseline can be used to monitor this parameter and alert the administrator about any deviation. In the screenshot below, we see that there is a config error on an interface that is configured as half-duplex instead of full-duplex. As a result, the number of collisions increased over time.
But that is not all. Besides the manually defined thresholds, Golden Baseline can also find deviations from the baseline on his own. Powered by machine learning, it provides an auto-calculation mechanism to set Golden Baseline(s) for any variables based on historical data generated through scheduled tasks. So, the baseline gets updated over time and always reflects what’s actually “normal” for your particular network.
Golden Baseline brings more proactivity to your operational workflows by understanding what has changed compared with a baseline representing a healthy state. Instead of trying to find a needle in a haystack, you can directly focus your efforts on analyzing the network change and the potential impact to your network.
To see more about Golden Baseline in action, request a demo here