What Happens After BGP?
Gaining Full Path Visibility in Hybrid Cloud Networks In the modern enterprise, Border Gateway Protocol (BGP) plays a foundational role in connecting distributed networks. It is the routing protocol that...

In the past, network documentation relied on difficult manual processes, hand-drawn maps, and notes to resolve issues, answer questions during audits, and meet evolving compliance needs. But today’s networks are more dynamic. The rise of cloud infrastructure, IoT devices, mobile workforces, and software-defined networking has created a scale, fluidity, and complexity that legacy documentation can’t handle. Traditional tools struggle to visualize hybrid environments or track application relationships in virtualized infrastructure.
Today’s network documentation requires operational visibility, automation, and resilience. Teams must adapt how they capture, manage, and maintain network knowledge to meet modern performance needs.
Network documentation is the foundation for understanding, operating, and managing an IT network. It encompasses the structured recording of a network’s design, configuration, and functions. It includes physical and logical topology, such as device locations, IP schemas, routing protocols, and firewall rules. It also includes procedural elements like change logs, access controls, and escalation workflows.
Documentation provides critical context — the why behind architectural decisions, the how behind the troubleshooting process, and the what of system dependencies. When done right, it becomes a shared source of truth across teams, improving response times, supporting compliance efforts, and enabling smoother onboarding and planning.
Network documentation preserves and shares critical knowledge across teams. It goes beyond just tracking IP addresses and hostnames. Documentation captures the wisdom built over years of managing complex systems. It’s a cornerstone of IT workflows, essential for everything from troubleshooting to scaling infrastructure.
However, updating documentation the traditional way is slow and error-prone. As network complexity grows, older tools and methods create gaps and inefficiencies. Static diagrams and outdated processes simply cannot provide the real-time visibility or context needed to make fast, informed decisions. Today, an automated, streamlined approach is a necessity.
As networks grow more complex and distributed, effective documentation must evolve to:
Mapping a network area manually with information gathered from the Command Line to complete a critical task is inefficient and robs the engineer of precious time. When every second counts, having quick access to the right information within the appropriate context is as valuable as gold. Reducing the time it takes to gather the information means network engineers can use their time for action.
We believe that for network documentation to be helpful, it must be accessed quickly, relevant to the task at hand, and presented in an easily consumable way, like in a Dynamic Map. Dynamic Maps have become the natural replacement for static network diagrams as they offer on-demand contextualized information about precisely what the network engineer wants to see.
They are built from live network data in seconds and can be customized for a specific task. The critical element here is time. Essentially, Dynamic Mapping enables access to the right map, with the right context level, exactly when it’s needed. This makes it the ideal solution for assisting network teams with critical tasks.
Research shows that the average network team spends three-quarters of its time fixing problems. Some of this valuable time is spent simply wading through a sea of details that, although important, are unnecessary for completing the task at hand.
Nothing is more distracting than dealing with the clutter of having too much information when only a small, relevant data set is needed to visualize an issue. The ability to focus on the right variables during a task can significantly help in condensing the time it takes to complete it.
The ability to offer the user several data views without having to harvest details manually from the CLI helps the network engineer to visualize the problem and get the contextualized information required to fix it. Having quick access to a mind-boggling amount of detail that can be turned on or off with one click is an essential characteristic of useful network documentation.
We recommend that network teams consider visual tools with these characteristics when sourcing a network documentation solution, because they offer the right amount of detail when needed, alleviating some of the reactive troubleshooting pain. Visual tools like Dynamic Maps can effectively help reduce MTTR and allow the team to become more productive in other areas.

Network teams conduct post-mortem reviews of every major network issue. However, documenting troubleshooting steps after the fact is a tedious practice. Teams are usually too busy putting out the next fire to record their lessons learned or troubleshooting best practices.
A critical element in maintaining a well-documented network is having procedures that can write or update themselves, as the subject matter expert goes about their business of troubleshooting. The right tool can enable network teams to document procedures and capture tribal knowledge as they work.
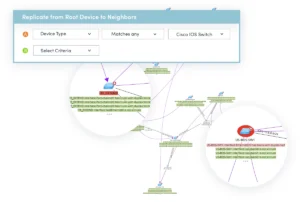
Quick Intent is a function that enables power users to create intents by defining simple diagnoses based on the current map devices. Whether the expertise resides in islands of knowledge within a team or a single individual, Intents can help codify this tribal knowledge by capturing expertise as logic in the Visual Parser, automating its use for the future.
Best of all, this can be done without needing any programming skills. Intents streamline the automation of any procedure and optimize collaboration among teams, effectively shortening the diagnostics and escalation times in future troubleshooting scenarios.

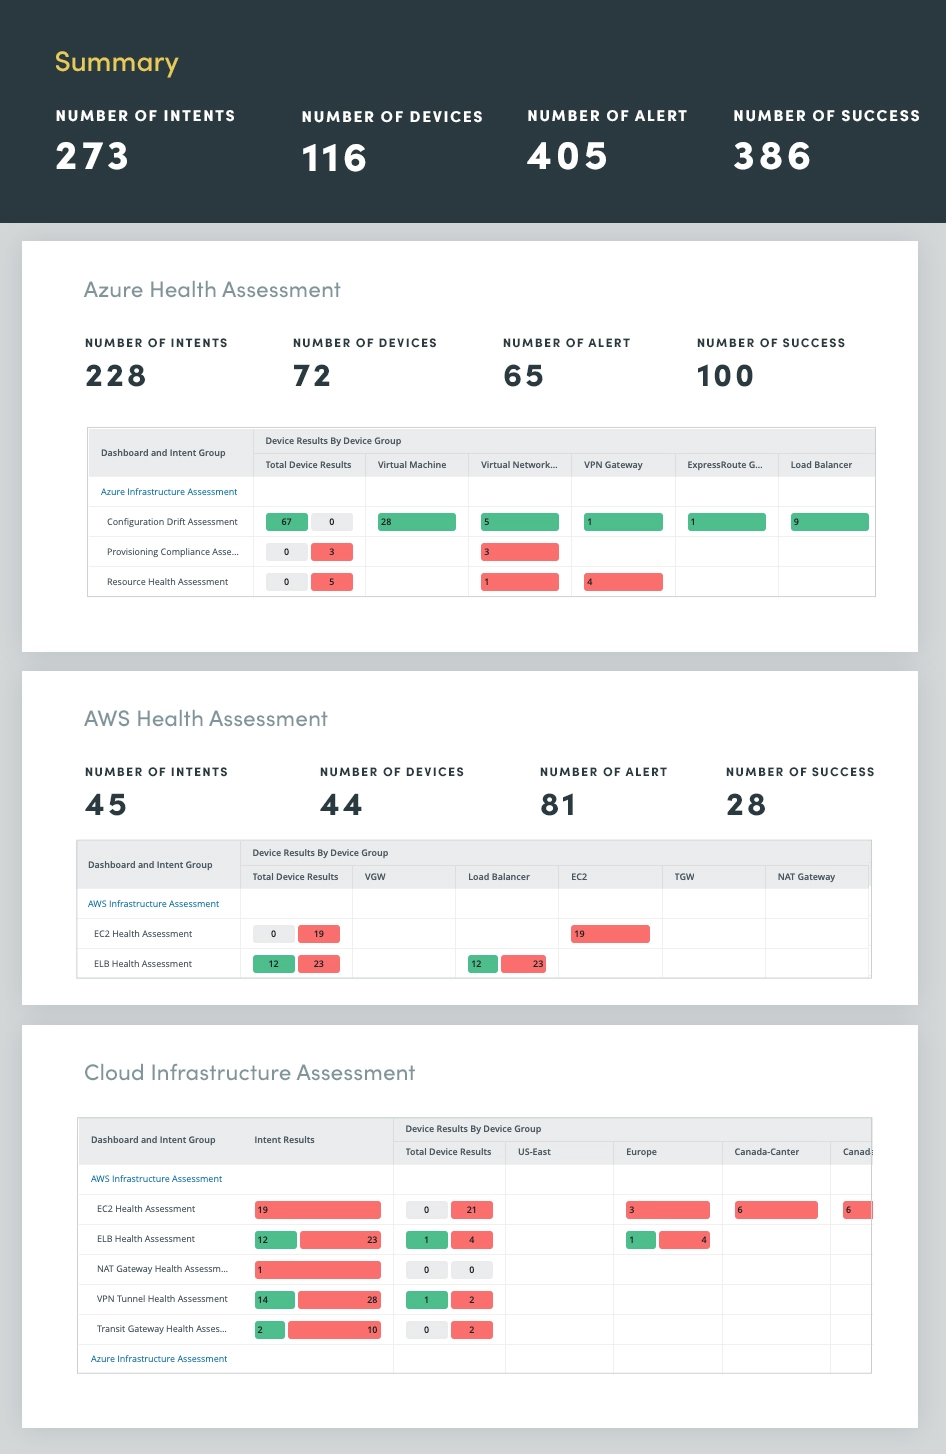
According to research published by the Enterprise Management Associates® (EMA™) in the Network Management Megatrends 2024 study, the typical team still has anywhere from 3 to 15 tools to manage their networks. They have access to a multitude of data points, which are relevant to their day-to-day operations but scattered in a myriad of dashboards behind disparate user logins. Visibility over key network assets or problems is fragmented at best.
To be a useful tool, information about the network must be relevant, quickly accessible, and provide context for action. Consolidating essential data from a variety of tools into a single view can improve visibility and help network engineers accelerate the completion of critical tasks, such as troubleshooting a problem.
A Dynamic Mapping tool that can extract vital metrics from other applications and present them graphically in a concise way gives network teams a significant advantage as they face new network challenges. Using the map as the coveted “single pane of glass” is the way of the future, and is available today as part of a comprehensive plan for network documentation.
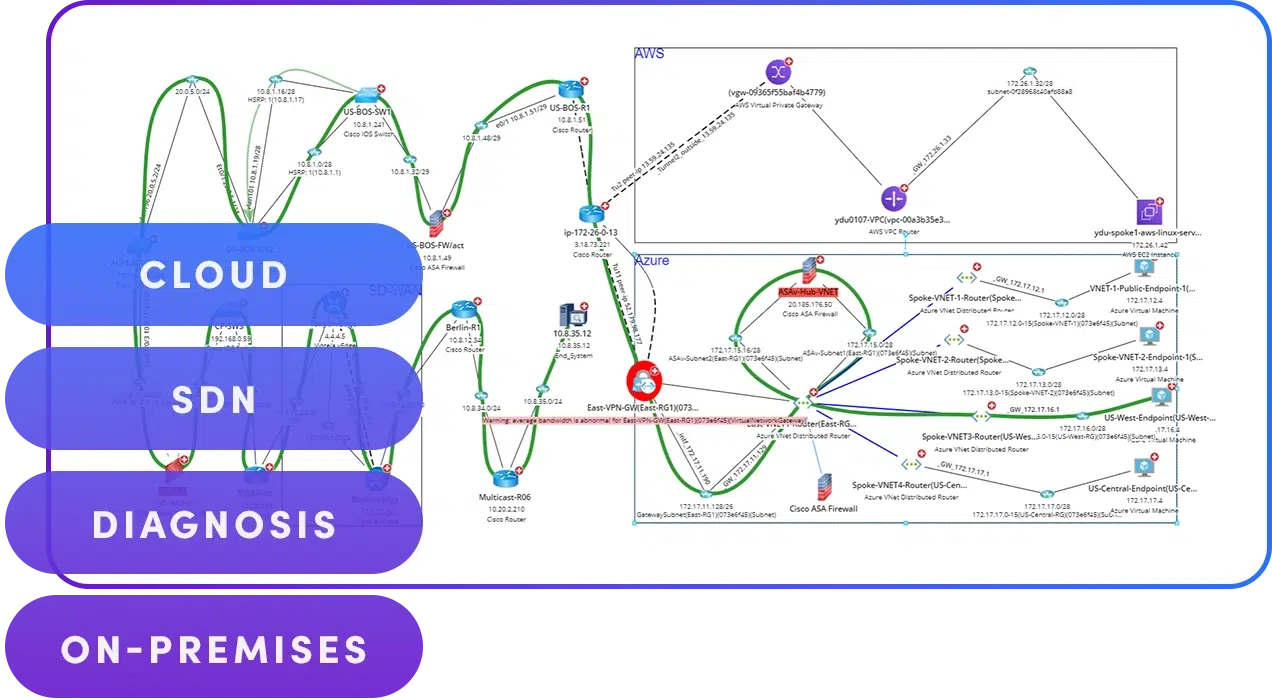
Software-defined networking (SDN) brings the promise of increased performance to the enterprise. More agility in application deployment and resource utilization is among the chief benefits, but the learning curve is steep. Network teams struggle to document even what they have today since they can no longer put their hands on the physical hardware. This issue is compounded by the challenge to understand and document how application dependencies map to the network.
Traditional methods to gather information — such as the Command Line Interface — will no longer work. As SDN becomes an ever-increasing part of the overall enterprise network, the inability to visualize assets or issues across multiple technologies could become a hindrance to smooth operations.
Network documentation tools must extend visibility across every part of the network, regardless of its architecture or deployment model. This ability to demystify and decode the complexity and abstraction of SDN infrastructures and present them seamlessly along traditional physical networks during the execution of critical workflows is a significant advantage.
The right network documentation software can ensure that all network components, whether on-premise or in the cloud, are accurately represented and continuously updated. Having visibility across hybrid infrastructures will enable network teams to keep pace with increased demands and empower them to act quickly when required.
Modern networks are more dynamic, distributed, and business-critical than ever, and how we document them needs to reflect that reality. Teams can reduce friction and operate with greater confidence by embracing an automated approach.
See how NetBrain’s turnkey network automation platform turns documentation into a living asset that supports automation, reduces downtime, and aligns network behavior with design intent. Schedule a demo to see how we can help your organization.