What is Network Visualization?
Network visualization, or visibility, is an understanding of the infrastructure and traffic flows in an organization’s hybrid network. The term also encompasses awareness of everything in and traversing through your hybrid network, as well as the use of visibility tools that enable this understanding.
Modern network visualization tools are used to enhance alertness and responsiveness for improved network monitoring and control over connections, application traffic, network performance, network resourcing, and data.
Why is Network Visualization Important?
Network visualization enables IT teams to operate with greater speed, clarity, and control by combining complex network components into a unified view. This visualization gives teams a clear, real-time view of how bandwidth, devices, and connections are used across the environment so they can spot underused or overloaded resources, track capacity trends, and prioritize the right services. Management of network resources is critical for effective and scalable network management and planning for growth, supporting new and existing services, and network health.
Additionally, network visualization software allows you to exercise greater control for decision-making so you can better meet the needs of the business without disruption. It affords you the ability to proactively react to any issues that arise and to prepare network diagrams and documentation much more quickly and accurately for regulatory compliance audits.
Network visibility helps you plan for future growth, be less reactive in your operations, and have greater success with digital transformation projects, including cloud migration, by helping you scale your network to deliver IT services at the levels businesses require.
Benefits of Network Visualization
Network visualization provides a simplified view of network traffic and helps with resource utilization. This allows organizations to identify areas that have inefficiencies, potential security vulnerabilities, or need improvements. Below are more in-depth looks at the benefits of network visualization.
- Effective Network Management and Planning
Dynamic network maps that keep updating provide visibility into an entire network, allowing administrators to understand its infrastructure. Understanding the infrastructure allows administrators to manage the network and know where to focus on troubleshooting. Having the ability to visualize current network dependencies, inventory, and resource utilization trends also gives administrators insights into network upgrades and capacity planning.
- Enhanced Network Visibility
Network visualization provides visibility, which enables swift issue isolation and resolution. It supports effective change management by facilitating impact previews to avoid downtime. Visibility into device configuration also allows proactive policy compliance checks to find and fix gaps or flaws like outages and congestion in time.
- Faster Troubleshooting
Visibility into a real-time graphical view of the entire network topology, including connections between devices and traffic flows, allows administrators to make informed decisions about where to focus their troubleshooting efforts. Faster troubleshooting means less downtime for the business and users. Problems can be resolved rapidly before they seriously impact operations or customer experience.
- Proactive Issue Resolution
Since network visualization provides enhanced network visibility, administrators can monitor the network constantly and identify potential issues before they impact operations or customers. With alerts and alarms on the network map or dashboard, administrators instantly know when there are issues or when devices become vulnerable. These dynamic updates allow administrators to resolve problems promptly before they escalate.
- Efficient Network Documentation
Unlike manual network documentation, which is time-consuming, visualization automatically discovers and maps the network, updating it as changes occur. This efficiency ensures accurate documentation that reflects current configurations, simplifying onboarding and knowledge sharing within network teams.
- Higher Staff Productivity
With a comprehensive visualization platform, network engineers and their teams become more efficient in their work. A network visualization tool eliminates routine tasks and speeds up troubleshooting, freeing time for more strategic work to better support the business and drive innovation.
- Better Communication
Network visualization improves communication by providing a centralized view of the entire network topology that everyone can see. A live map overview gives remote and field staff the same network context as in-office teams for consistent discussions. This shared perspective streamlines discussions and ensures teams work from the same common operational picture when managing issues or planning changes.
- Support for Digital Transformation
Through digital maps, network visualization enables digital transformation by providing network visibility, guaranteeing service quality, rapidly resolving issues, identifying bottlenecks, preventing errors, and optimizing energy use. This ensures reliable, efficient networks can scale as digital services migrate to cloud-based operations and traffic increases.
Types of Network Visualization
Effective network visualization is not a one-size-fits-all approach. Engineers rely on different visualization formats depending on the task at hand — whether it’s diagnosing an outage, analyzing performance trends, or maintaining compliance. Network maps, charts, graphs, and dashboards each offer unique perspectives that make it easier to interpret complex environments and take informed action.
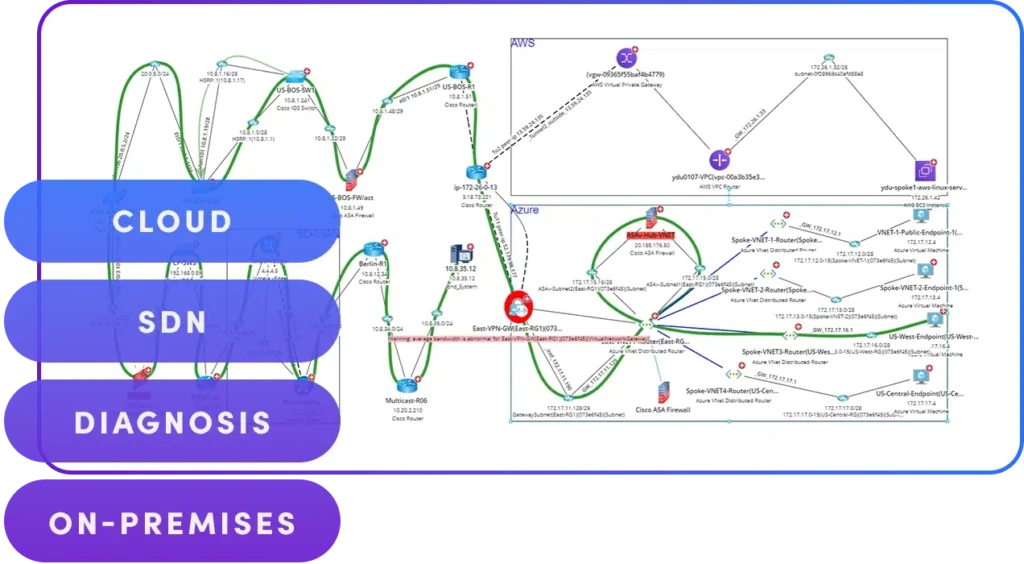
Network maps
Network maps provide a visual representation of the physical network topology, including infrastructure connections and relationships between devices. You can use either of the following:
- Static network maps: To capture a single point-in-time topology snapshot
- Dynamic maps: To automatically update and view network changes
Charts and graphs
Charts and performance graphs showcase key network metrics over specified time frames, allowing teams to easily identify trends, anomalies, or relationships between factors. Pie charts may break down traffic by device or protocol, while line graphs show bottleneck events. Meanwhile, graph network visualization helps identify trends and patterns that can impact network performance.
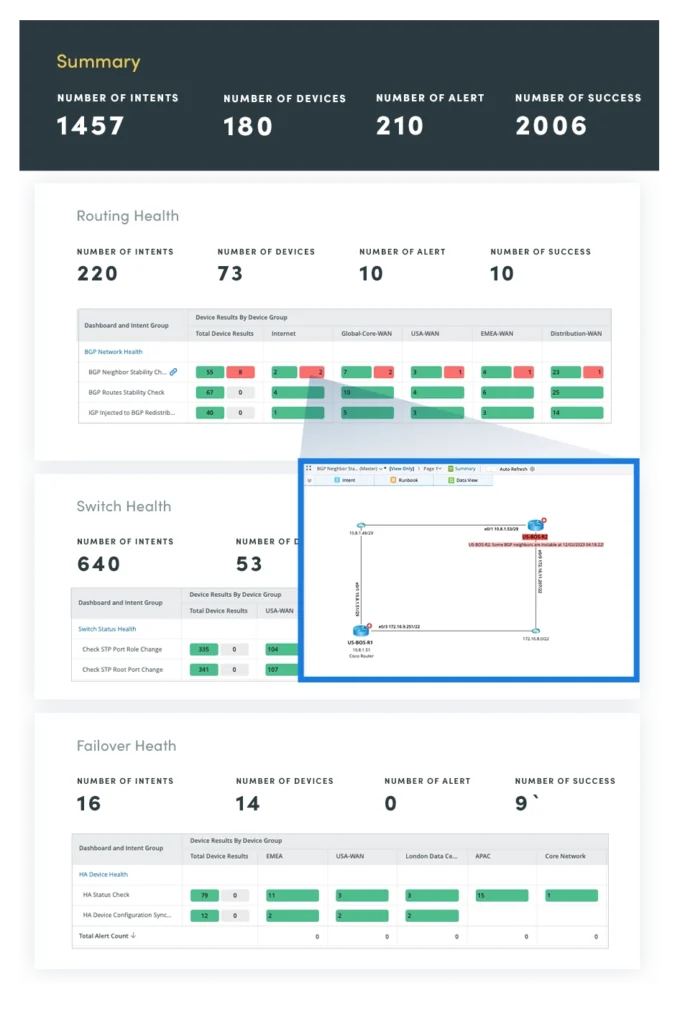
Dashboards
Dashboards aggregate visualizations like maps, charts, and key performance indicators onto a single screen. This unifies critical data for at-a-glance network health and activity monitoring from a centralized home base. Alarms on dashboard widgets ensure nothing falls through the cracks.
When Would I Use Network Visualization?
Network visualization proves invaluable during times of rapid expansion when it’s paramount to understand dependencies before changes occur. It also streamlines network troubleshooting by guiding engineers to the root causes of issues through real-time topological context. Whether optimizing existing systems or scaling to meet growth, network visualizer software allows you to proactively monitor your network, visualize and resolve issues, and plan for the future of your IT infrastructure.
Network Visualization Best Practices
Implementing network visualization effectively demands a disciplined, strategic approach. From understanding how devices interconnect to ensuring your visualization efforts support security and scalability, following proven best practices is essential. The right foundation improves daily operations and prepares your network to adapt as technologies and business needs evolve.
Understand Your Network Topology
A thorough understanding of your network topology is crucial. Use dynamic network visualization tools for network topology mapping to stay up to date, as these maps reflect changes in real time.
Prioritize Security
Ensure your network visualization includes insights into network vulnerabilities. Regularly review and update your network security policies based on visualized data.
Use the Right Tools
Choose network visualization tools that integrate seamlessly with your existing infrastructure. Tools that support interactive network visualization can enhance your ability to effectively manage and troubleshoot your network.
Keep Documentation Updated
Automate network documentation processes to ensure accuracy and efficiency. Updated documentation aids in troubleshooting and capacity planning.
Plan for Future Growth
Use network visualization to identify trends and plan for future network expansion. This proactive approach can prevent bottlenecks and ensure your network can scale as needed.
Single-pane-of-glass promises complete end-to-end visibility across the IT environment, but it’s seldom achieved. Today’s networks span distributed data centers, hybrid multi-cloud environments, and internet-connected brand offices. Most tools cannot deliver full-path awareness — here’s why:
- Only devices from the same vendor are visible.
- Adding a single switch or appliance from another vendor introduces blind spots.
- Some solutions omit critical areas like WAN, data center edge, or public cloud.
Network visualization often lacks real-time input from IT Service Management (ITSM), Network Performance Monitoring (NPM), and security platforms. It also lacks data to inform intent, performance, and operational decisions. Teams must manually correlate data from multiple sources, spend time switching between dashboards, and miss root causes buried in surrounding systems.
True single-pane-of-glass visibility:
- Unifies network visibility across domains, vendors, and platforms: Integrations must be API-driven and seamless with a shared visualization layer fed live contextual data.
- Delivers real-time and historical context: Teams should be able to compare current and past configurations and identify problems from failed change management or other processes.
- Makes collaboration seamless across all stakeholders: Network Operations, including SecOps, DevOps, and CloudOps, must work from the same live model and be able to collaborate from anywhere in real time.
Enhance Network Visualization with NetBrain
While many suppliers claim to offer single pane of glass visibility, users rarely feel like they have this unified visibility due to disconnects between different parts of the network and the ecosystem of tools surrounding them. But customers of NetBrain have had this visibility for years and use it every day!
At NetBrain, we provide unified, single-pane-of-glass visibility across the entirety of your hybrid network infrastructure. By automatically discovering all network nodes and devices and leveraging ecosystem data to build a complete Digital Twin, NetBrain’s pane eliminates NetOps pain.
Schedule a demo to see how we can help your team achieve single-pane-of-glass visibility.
 by
by