What Happens After BGP?
Gaining Full Path Visibility in Hybrid Cloud Networks In the modern enterprise, Border Gateway Protocol (BGP) plays a foundational role in connecting distributed networks. It is the routing protocol that...

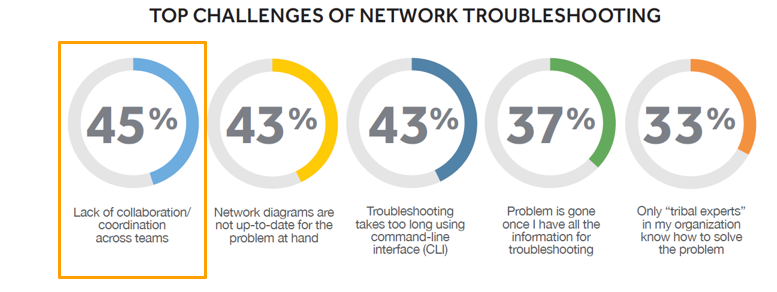
Today’s network problems increasingly require more than a single engineer — or more than one team — to resolve. These problems may involve a part of the network (or a technology) that you’re not familiar with, they may be those really tricky issues that need to be escalated to a senior engineer who has more extensive “tribal knowledge,” or they may be problems that lie outside your immediate domain of responsibility. This type of collaborative troubleshooting is not uncommon, and gaps in cross-IT collaboration are significant. NetBrain’s State of the Network Engineer survey revealed the lack of collaboration as the #1 obstacle to effective troubleshooting.
So, what’s preventing collaboration within and across teams? Rarely is it because there’s some kind of intentional obstinance — an “us vs. them” mentality. It’s not like we don’t want to collaborate with other engineers or other groups. It’s not that less-experienced personnel are just passing the buck, or that senior-level guys love firefighting. Collaboration is hobbled because it’s so difficult to:
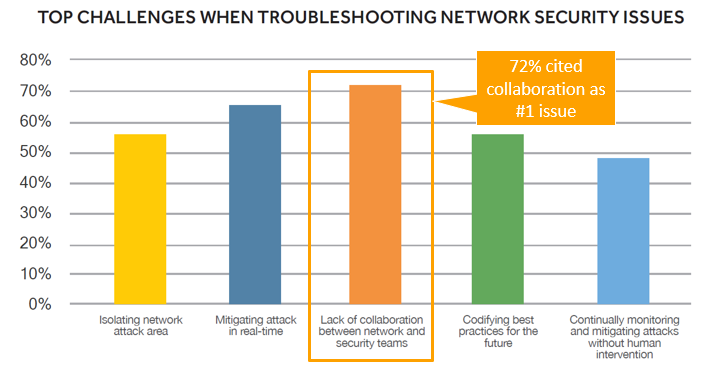
These challenges are even more pronounced when talking about mitigating network security issues, when effective collaboration can often mean the difference between a well-engineered, timely response to a threat and an attack taking down your network.
Today’s large networks undergo constant change — break/fix modifications, device and software upgrades, architectural evolution — with changes being executed by different people and different teams. Traditional network diagrams become obsolete quickly, and all too often critical design notes and other documentation are incomplete (more likely, nonexistent). Modern enterprises have a disparate and decentralized understanding of their network, from campus to campus, functional team to functional team. The days of individual engineers having expertise in all areas of an enterprise network are over.
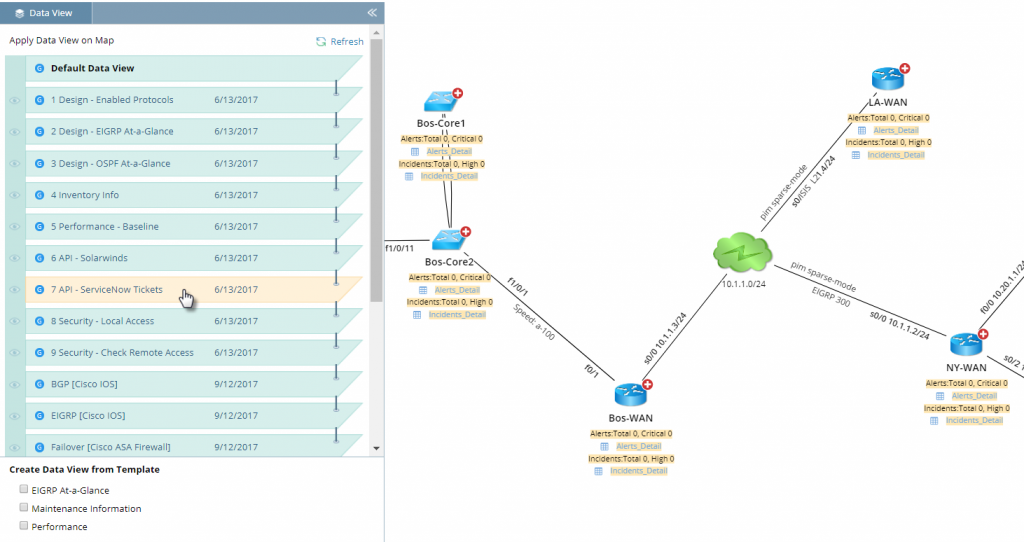
This introduces a visibility problem: you don’t have a clear picture of what the live network actually looks like. Too often you simply are unable to visualize the critical IT data at the moment it’s needed, contextualized for your particular task at hand. Traditional network diagrams are only icon-driven topology maps, where static images represent devices but lack intelligence. NetBrain Dynamic Maps, on the other hand, are data-driven — each element represents a “digital twin” of a live network device, with hundreds of data attributes, including its configuration file, routing protocols, neighbors, and more. The deep discovery (via not just SNMP but also telnet/SSH) that builds this mathematical model means that the documentation you need to effectively troubleshoot is maintained and updated automatically. You can custom-build a map specific to the task at hand on demand: complete and accurate information is available at your fingertips when you need it most.
NetBrain’s deep discovery means you can custom-build a map specific to the task at hand on demand.
Bottom line: you now have not just a diagram but a shared forensics console with virtually infinite detail that’s accessible to anyone anywhere. All relevant network information is available to visualize right on the map, making it easier to share with other teams. Simply toggle on or off the contextual data you need for the problem you’re troubleshooting. Instantaneously see your EIGRP or OSPF design at a glance, check Active/Standby status for ASA failover devices — the list goes on. Virtually any data from any source can be captured in a Dynamic Map — performance data from your 24×7 monitoring tool (e.g., SolarWinds), open tickets from ServiceNow, Splunk data. If it’s got an API, NetBrain can ingest the data and link back to the source system right from the map.
NetBrain’s unique capability to bring together (a) telnet/SSH data from any device in a multi-vendor network and (b) relevant information from other sources via REST APIs mean that you can now visualize SDN constructs like the Cisco ACI fabric as well as your traditional network on one Dynamic Map. This is invaluable when troubleshooting a slow application that flows across both the ACI fabric and legacy network, for example.
 Toggle on or off virtually any network information — including other NMS data — right on the map.
No more e-mailing log files and plowing through text-based data dumps. No more digging through the CLI manually, one device at a time, one command at a time, or jumping from screen to screen among various tools to cobble together information.
You get comprehensive insight into your network on a true single pane of glass where anybody and everybody can actually put the data to use — the map.
The typical manual, repetitive troubleshooting workflow involves a lot of duplicated effort to verify data. As cases get escalated between different levels of engineers, usually the diagnostic data is either too much or too little. When we’re under the gun, all too often we leave only cursory notes for the next-level engineers. Critical information gets lost along the way, or is buried inside of log dumps. If you’re the next man up, you have to re-run the same diagnoses that the previous guy did — either because it’s faster than pawing through a bunch of text data or because you simply don’t have confidence that he was asking the right questions. You wind up reinventing the wheel.
But with Automated Runbooks, all those “first best step” diagnoses you always run can be performed automatically — with the results captured and recorded automatically. Next-level engineers can see exactly which analyses have already been run (and when and by whom), with the diagnostic results clearly presenteed on the Dynamic Map in context.
All too often, you wind up re-inventing the wheel — re-running the same troubleshooting diagnoses simply because you can draw insights from the previous guy’s data dump.
In the example below, the Runbook annotated the QoS configuration on the portion of the network mapped, automatically ran CLI commands across all devices in one fell swoop, highlighted the queue strategy, and checked QoS performance metrics. All results from those steps are available on the map. As a next-level engineer, you’ve just avoided the merry-go-round of repeating diagnoses.
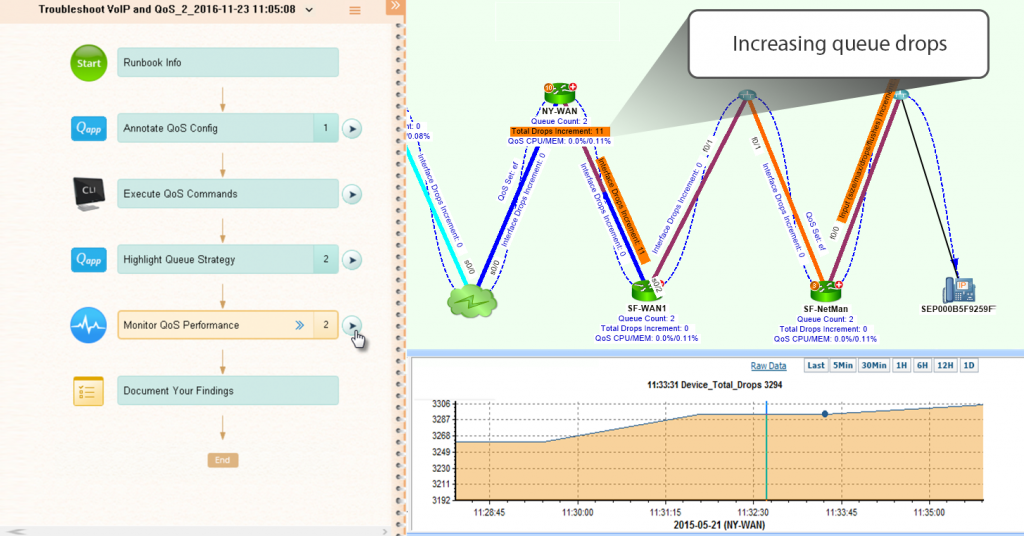 When troubleshooting QoS, Runbooks make it easy to share performance metrics on the map (current queue count, total drops, reachability and QoS CPU/memory utilization).
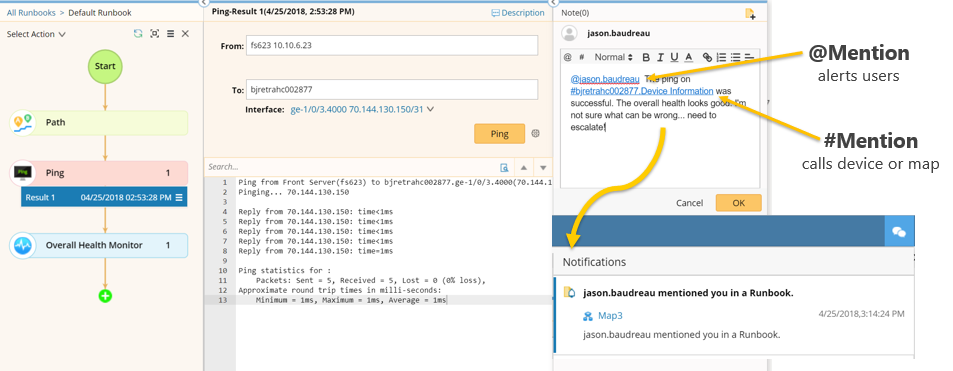
Runbooks also make it easier to communicate effectively with other engineers and other teams. You can alert a particular person to a particular device or map when escalating issues. In the example below, I (as the first-responder engineer) calculated the A-B path between a web server and database server, ran a ping test, and ran an Overall Health Monitor Qapp (one of NetBrain’s customizable programs that leverage automation to pull data from network devices and analyze it) that monitors the top 5 causes of network slowness (interface status and link performance like delay, errors, and utilization). Everything looked okay, so I need to kick the problem along to a second-level engineer, Jason. The @Mention function pinpoints the request for help to Jason, and the #Mention feature specifies the unique URL of the Dynamic Map where he can find all the diagnostic results. Now I’ve given Jason a running start into finding out what’s wrong — he doesn’t have to start from scratch.
 Runbooks make it easier to share insights and escalate issues when collaborating on an event.
After the problem is resolved, usually any post-mortem analysis is limited. The raw data we collected during troubleshooting (CLI output) is lost, and I may or may not have learned anything that would help me the next time this type of problem crops up again (which it most probably will). If I’m lucky, Jason — the guy I had to escalate the problem to — would have showed me what he did. But Jason’s like most every other experienced network engineer nowadays: once this particular issue is taken care of, there’s a million more on deck. He simply doesn’t have time to explain how he did it, he just got it done and moved on.
That’s where NetBrain Runbooks come in. He could run his troubleshooting steps in the Runbook (doing the same things he would do manually, only having NetBrain perform them automatically) so that they get documented on the fly. No coding required. Next time this kind of problem rears its head, I can execute this Runbook and perform the same next steps Jason did.
Basically, we’ve transferred his know-how and enabled him to share his expertise without missing a beat.
 Everyone can digitize their particular expertise into Runbook workflows without needing any special programming knowledge.
Network engineers no longer have to worry about who’s on the right file share, circulating printed binders or relying on a spiral-bound handwritten notebook in a fireproof box in the NOC. Instead, all the data teams need to work together is contained within the NetBrain platform.