DORA: What Financial IT Must Know
The Digital Operational Resilience Act (DORA) entered into application across the European Union on 17 January 2025, reshaping how financial institutions manage cyber and operational risk [1]. Although the United...

The role of the network engineer is evolving, but before you roll your eyes and say, “oh no not another network automation article,” hear me out. There are some great articles out there exploring how network automation is part of this change, but since leaving the VAR world a couple years ago, and working internally in a few larger enterprises, my actual day-to-day job seems to focus more and more on one thing: analytics.
Analytics is the collection and interpretation of data, and network analytics is the collection and analysis of data from our network infrastructure especially regarding application performance. I’ve always been in relatively traditional network engineer roles, so I’m not concerned with analyzing data simply because I love data. Instead, I want to use that information to find patterns, correlations, and something meaningful and actionable to improve the network in some way.

The shift for me over the last couple years has required that I focus less on how to configure a data center core cutover and more on figuring out what’s really going on in the network day-to-day. This has had to do specifically with troubleshooting poor application delivery, information security, and capacity planning. And all of it required network data analytics.
Soon after taking a position at a large enterprise, I got an email from a scientist who managed his team’s high-performance computing clusters. At about the same time every night, data transmission to our external customers failed and then took many minutes to recover. These scientists collected a huge amount of atmospheric data throughout the day which they then analyzed for customers who purchased the reports, the raw data, or both. Some of these customers were very large scientific institutions that pulled this extremely time-sensitive information over FTP.
The application that managed the cluster lived on a bare metal server that sat at the top of the rack and hooked in to the cluster via some proprietary connectivity but was also connected to the LAN for management purposes and to serve up the completed reports. The failure was happening with several customers, so I dismissed that the issue was on their end. It had to be on ours. Something was happening on one of our hosts, the cluster controller, or somewhere in our network path.
The lead scientist took ownership of the incident and checked to see if the application and the servers were operating correctly. Everything seemed ok on his end, so he suspected a network problem. We couldn’t easily pinpoint any network activity that would have conflicted, so I started by looking at the configuration of all network devices in the path. I logged into switches, firewalls, and routers but didn’t see anything awry.
What was going on here? The logs would reveal the answer. Using the software we had at the time I saw that we were collecting very little information from very few devices. There wasn’t much else to look at. We needed some sort of meaningful information. Sure, I could have poked around devices all night to see what was going on in real-time, but I knew I wouldn’t be able to easily correlate anything. Instead, I configured our data collection tool to collect from everything on the network. I configured SNMP on some devices, NETFLOW on others, and for those that supported neither, I configured the collection tool to continually ping those IPs and scan their open ports.
After a few days of phone calls, Googling, and chatting with the lead scientist, one customer grew very impatient and angry that their imports failed almost nightly. This became a high-profile issue and a top priority for me. I dedicated more storage space to the data collection software and let it run for a week. When I dug into the results, I spotted an unusual spike in the application controller’s CPU at about the same time every night – the time the problem started. This was a good start, but there was no reason the lead scientist could find on the server itself that would cause this. The network links saw no unusual congestion, and none of our switches in the path showed anything unusual at all.
Because our collection tool was mediocre, I had to spend quite a few hours poring over all this new data myself. My co-worker helped by writing a script to search for CPU, link, and memory utilization and then present that in a graphical format through some sort of clever email connector. After all that time and effort, a red flag appeared pointing us to an access switch that had a CPU spike every night. I logged in to the switch and saw that the uptime reflected a likely reboot at the fateful time the previous night.
Before leaving work, I replaced the switch, made sure that IP address was one of the widgets on our monitoring dashboard, and set up a simple persistent ping. My co-worker wrote a script to email us if pings dropped, and we set up the monitoring software to send out an alert if the CPU spiked. To our dismay, the next morning we had emails notifying us that pings dropped and notifications from the collection software that CPU spiked. We checked the switch – it was on. I checked uptime – showed a reboot in the middle of the night. We were certain that the answer lay in the data. But it was so tedious to mine through it and taking much too long for our customer. Somewhere in there must have been a pattern or correlation that we hadn’t found, so we kept looking. We needed a better way to do this, but for now, we plodded through using the software and custom scripts as best we could. Then we found something. An unknown device at an unfamiliar IP address became very chatty about when the switch rebooted. It wasn’t a duplicate address, and it wasn’t on the same subnet, but it was something that happened the same time every night.
Tracking down the device was easy. It wasn’t in DNS, but it was a reservation in DHCP. It turned out to be the controller for the backup AC which was kicking on every night. This normally wouldn’t be an issue, but when we went down to the server room we found that the AC unit was plugged into the same PDU as the switch. There was nothing else on the PDU, and it wasn’t something we looked at before.
When the AC unit kicked on there was enough of a drain on the circuit that the switch rebooted. At least that was our theory. We moved the switch to a different PDU and placed a call to the HVAC people. The switch didn’t reboot that night, and from what I understand the HVAC people found an issue with a sensor and the electrician fixed the power issue.
Figuring this out required gathering a lot of data and analyzing it intelligently. That’s where my network engineer colleagues and I find ourselves these days working in enterprise IT. Sure, there’s the occasional firewall upgrade or MDF switch replacement, but mostly I’m collecting and analyzing data trying to troubleshoot application performance or work on an information security task.
I don’t believe the role of a network engineer is changing such that we need to become programmers and data scientists, but what I do see is a growing trend to be very skilled in knowing how to collect and analyze a tremendous amount of dynamic and ephemeral information.
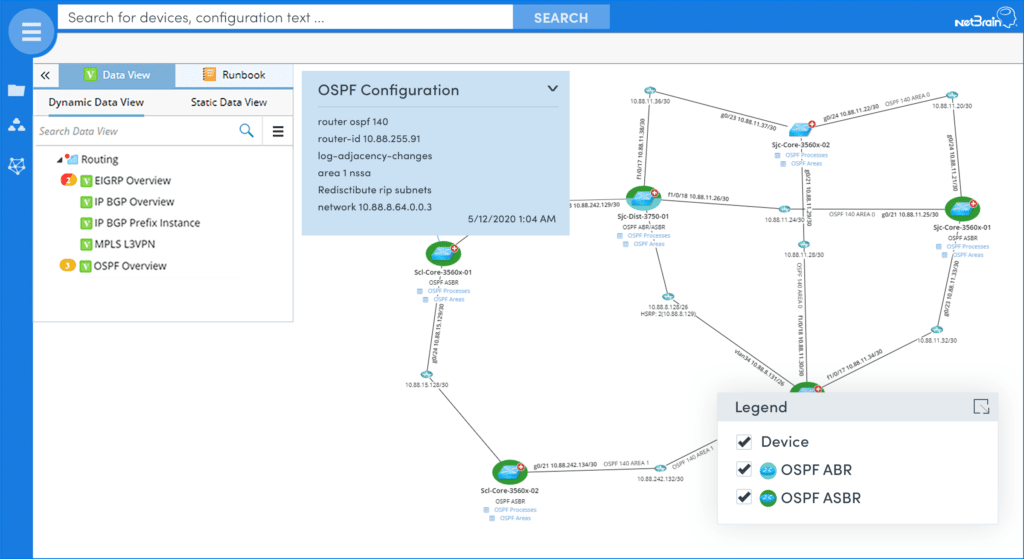
NetBrain recently announced a very promising technology that aims to tackle this analytics challenge – they call it Executable Runbooks. Basically, a Runbook offers a way to automatically collect and analyze network data. Since these Runbooks can be adapted (by programmers and non-programmers alike) they can be used to perform analytics for any network function. The example below is a Runbook that was written to analyze OSPF routing design.