 by Jul 11, 2018
If you’re like most network engineers, near the top of your list of Most Frustrating Tasks is trying to network troubleshoot a problem that’s no longer in play. We’ve all been there: you open up a trouble ticket, but whatever circumstances originally caused the problem have now changed, and the issue seems to have vanished into thin air. Best we can do is close the ticket as NTF (no trouble found) or CND (cannot duplicate) and hope it doesn’t crop up again. (Spoiler alert: It will, and probably at the worst possible time.) And with SDN “getting real,” we’ll only see more of these ephemeral intermittent problems moving forward.
It’s almost impossible to reproduce these intermittent problems and you have to get lucky to see them “live” in real time. But now with NetBrain you can trigger an automated diagnosis of a problem the moment it occurs — network troubleshooting with “just in time” automation.
Actually fixing an intermittent problem is pretty straightforward. But pinning it down is not.
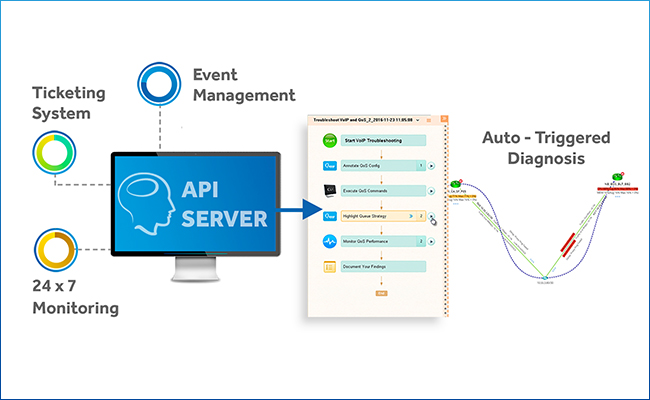
NetBrain Integrated Edition introduces API integration with other network management systems — like ServiceNow, your IDS/SIEM, Splunk, 24×7 monitoring solutions — so that as soon as an alert is raised, the path of the problem area is automatically mapped, and Executable Runbooks instantly kick into action to capture all the data and analytics about the event in real time. We call this “just in time” automation because as an event is happening, all the data you need about the problem is automatically collected, analyzed and visualized in context on a Dynamic Map. No human involvement is needed. When you respond to the incident, everything is just waiting for you.
The ABCs of “Just in Time” Automation
At the moment of an event, “just in time” automation performs two distinct actions:
- A map of the problem are is dynamically created.
- A pre-defined set of procedures is automatically executed to perform a “level-0” diagnosis.
Dynamic Maps Automatically Define the Scope of the Problem
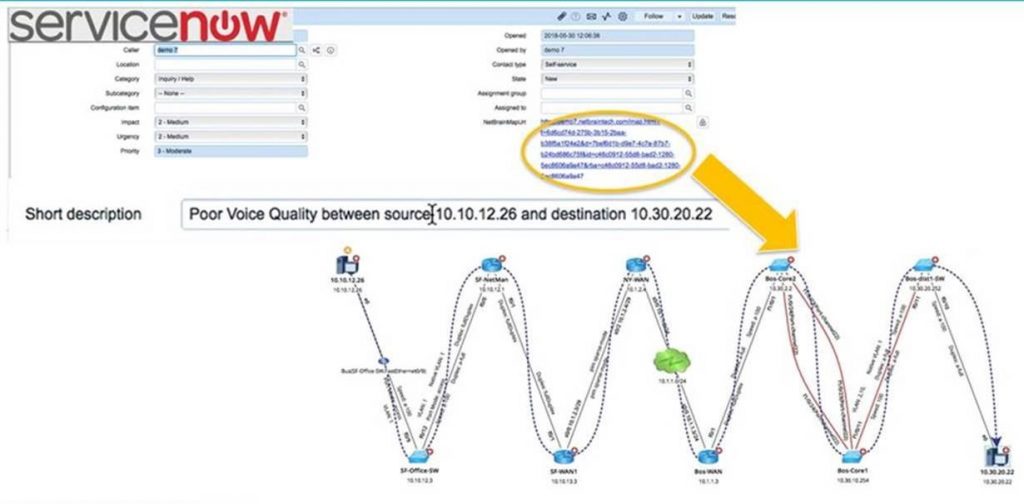
Let’s say that overnight your 24×7 monitoring tool detected that an application was running slowly and a ServiceNow ticket was created. The ServiceNow ticket automatically triggered NetBrain to map the path along which app traffic was flowing between the web server and the database server —and every hop in between — at that very moment. This is not your average traceroute: NetBrain logs into the default gateway of the web server to begin analyzing the path, starting with the routing tables and then analyzing advanced parameters (VRFs , ACLs, PBR, NAT, and more). And you’ll see the reverse flow path as well — crucial insight if the application traffic is asymmetric. This gives you an accurate scope of the problem in real time — not at some later point in time, after the network has dynamically has changed the traffic path for any number of reasons or after earlier troubleshooters have tried to remap the application. A URL of the map is written right into the ServiceNow ticket. One click and you’re into the Dynamic Map, which can be enriched with additional performance information from your monitoring solution (or any other system with an API). Everything is right there on a single pane of glass.
“Just in time” network troubleshooting performs the same steps you would, only automatically — without you having to be there when the alert came in.
Runbooks Automatically Execute Steps to Diagnose the Problem
At the same time — again, automatically — an Executable Runbook collects performance data and issues CLI commands across multiple devices from multiple vendors in one fell swoop to get the relevant data you need to figure out exactly what’s causing the slowness. You see what the memory and CPU utilization looked like when the alert was sent, as well as interface status. The Runbook will automatically search for interface collisions and CRC errors across the traffic path, check for speed or duplex mismatch, duplicate OSPF IDs, misconfigured AS numbers for BGP neighbor connections, etc. Since our first question is always, “What changed?” a Runbook performs a comparative analysis of topology and routing between when the problem was detected and some previous point in time (when the app was running just fine). There are hundreds of automated diagnostics available out of the box, and you can customize a Runbook to run virtually any data collection or analysis task — without having to write a single line of code.
(Matt Speidel goes into greater detail in How Executable Runbooks Work.)
The Runbook performs the same network troubleshooting steps you would, only automatically — without you having to be there when the alert came in. And all diagnostic results are documented in the Runbook that’s attached to the map. Just click on the URL of the map in the trouble ticket, and all the data collection and analysis you would’ve done anyway has already been done for you.
A senior network manager I know once said that intermittent problems aren’t especially intermittent; it’s just our awareness of them that is. Chances are, if a problem cropped up once, it will rear its ugly head again — or somewhere else in the network. NetBrain has introduced a new capability that allows you to leverage its automation power to continuously and proactively monitor for whatever problem you just solved. In other words, those mysterious intermittent issues become known problems.
We can also think of this event-triggered automated network troubleshooting as a “level-o” diagnosis” because all the data collection, analysis, and visualization has been done before a level-1 engineer even starts investigating the issue. In fact, automation handles all this work before a human ever enters the picture.
You can’t fix what you can’t see. In today’s fast-moving network environments, too often problems have disappeared by the time we go to troubleshoot them. Usually actually fixing an intermittent problem is pretty straightforward. But pinning it down is not. That’s where “just in time” automation comes in.