 by NetBrain Nov 1, 2017
Enhanced Interior Gateway Routing Protocol is common in many enterprise networks, valued for its speed and scalability. But when problems arise — like lost adjacencies, routing loops, or mismatched metrics — pinpointing the cause can be difficult. Trial-and-error troubleshooting wastes time and often overlooks underlying issues.
A structured method is the only way to diagnose quickly and prevent repeat problems. Automation takes this further by eliminating manual guesswork, giving you instant visibility into topology, configuration, and routing behavior so you can resolve issues faster and keep the network stable.
What Is EIGRP?
Enhanced Interior Gateway Routing Protocol (EIGRP) is a Cisco proprietary distance vector routing protocol commonly used in modern networks. It speeds up convergence by storing backup routes in the topology table and using them when a primary route fails. There are many common failures that may occur to inhibit successful EIGRP routing, for example:
- Failure to form neighbor relationships
- Routes missing from the topology or routing table
- Routes not being redistributed into EIGRP
- EIGRP routes stuck in Active state
Why EIGRP Troubleshooting Matters in Today’s Enterprise Networks
EIGRP supports applications that demand high availability and fast convergence. However, failures can quickly disrupt traffic flow, affecting everything from business-critical applications to cloud connectivity. Relying on manual checks is not practical in complex hybrid and multi-vendor environments.
Delays in detecting and resolving EIGRP issues can cause extended downtime and lost productivity. Effective troubleshooting prioritizes network stability, maintains optimal performance, and allows engineers to address potential problems proactively before they impact users or applications.
Network automation helps you troubleshoot EIGRP routing problems more efficiently. You can instantly create a Dynamic Network Map to target an EIGRP Autonomous System (AS), then you can drill down with automation to diagnose neighbor adjacencies, route table changes, and configuration discrepancies in real time.
This methodology can be applied toward troubleshooting other dynamic routing protocols, including OSPF, IS-IS, RIPv2, and BGP.
How to Streamline EIGRP Troubleshooting
Sure, you can run show commands when EIGRP breaks, but that’s not going to solve complex issues – you need to see the bigger picture of how the protocol operates across your network. This means seeing neighbor relationships, configuration details, and protocol parameters in real time to isolate issues quickly. NetBrain makes this process faster and more reliable. Here’s how to troubleshoot EIGRP in six steps.
1. Map the EIGRP AS Instantly
Before you can drill-down and understand the problem, identify the EIGRP-enabled routers in the network, which should be forming neighbor relationships and exchanging routes. With NetBrain, one method of targeting the problem is to map around the EIGRP AS that is having the issue. You can do this with a few clicks. After mapping the relevant EIGRP AS, you can dynamically add neighbors to the map to expand the scope of your visibility.

Instantly Map an EIGRP Autonomous System
As you expand the map, you can turn on ‘highlighting’ to see the boundaries of each EIGRP AS. Both the interior and exterior gateway protocols will be highlighted automatically.

Automatically Color-Code the Map with Routing Design
2. Troubleshoot EIGRP With NetBrain’s Map EIGRP Neighbor Status App
NetBrain allows you to collect and analyze data from the network without logging into multiple switches serially and typing in a string of show commands. It has various built-in apps to automate routing diagnoses. Most importantly, you can easily write your own apps to automate your most common troubleshooting tasks. These apps leverage the map as the ‘canvas’ for your targeted data analysis.
Here’s how to use the Map EIGRP Neighbor Status app to troubleshoot with automated diagnosis. The app adds the functionality to annotate the current EIGRP neighbor status on the map using the show IP EIGRP neighbors IOS command. This can help you immediately identify if any adjacent routers are failing to form neighbor relationships.

Map EIGRP Neighbor Relationships
3. Highlight EIGRP Configuration
When you troubleshoot EIGRP or other dynamic routing protocols, you need to understand the relevant configuration on each device. To save you time in digesting lengthy config files on each device, this app is designed to parse the EIGRP configuration, route summary, and route manipulation from the configuration files for you automatically. The output is appended to each device on the map as a note, for quick reference.

Annotate EIGRP Configuration on the Map
4. Monitor Running Status to Troubleshoot EIGRP
The real-time status of EIGRP — including neighbors, EIGRP routes, EIGRP prefix, and the EIGRP CPU/memory — can provide important insights. This information can help you understand whether routes are missing from the route tables, or if routes are being redistributed properly. This app, when running, will continuously monitor real-time EIGRP status and display the current status under each router on the map.

Display Real-Time EIGRP Status on the Map
The historical data for every metric is automatically captured, plotted, and saved directly to the Qmap file for as long as the app is running. Monitoring for fluctuations in this data can provide clues about what’s going on.

5. Highlight EIGRP Parameters
To calculate a metric for evaluating path selection, EIGRP combines weighted values of different network link characteristics, including:
- Delay (measured in 10s of microseconds)
- Bandwidth (measured in kilobytes per second)
- Reliability (in numbers ranging from 1 to 255; 255 being the most reliable)
- Load (in numbers ranging from 1 to 255; 255 being saturated)
Various constants (K1 through K5) can be set to produce different routing behaviors. But by default, only delay and bandwidth are used in the weighted formula to produce a single 32-bit metric:

When K5 is equal to 0 then [K5/( K4 + reliability)] is defined to be 1
When K5 is equal to 0 then [K5/( K4 + reliability)] is defined to be 1
Using the default constants reduces the formula above to (Bandwidth + Delay) * 256
These K-Values and the Hello/Hold-down Timers are configurable EIGRP parameters which may influence EIGRP performance.
The Highlight EIGRP Parameters app is designed to quickly identify the existing parameters on each device, and draw a note on the map to reflect them.

Automatically Annotate the Map to Reflect K-Values and Hello/Hold Timer Values
6. Compare Historical Routing Data
An unverified routing or configuration change may have disastrous effects on the network. That’s why sometimes the best question to ask while you troubleshoot EIGRP is ‘what changed?’ This app can find specific changes in configuration, route tables, EIGRP neighbor tables, and much more. It leverages historical benchmark data (collected automatically by the system) for the comparison.
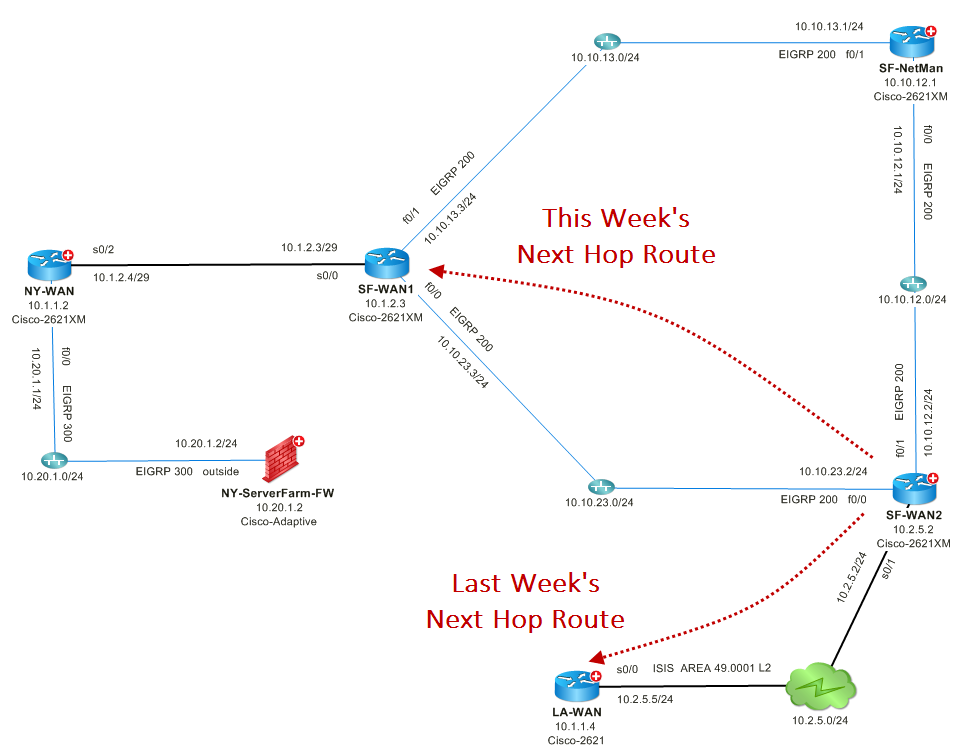
Compare Route Tables Visually
Benefits of EIGRP Troubleshooting With NetBrain
NetBrain turns network complexity into actionable insight. When it comes to EIGRP troubleshooting, NetBrain maps neighbors, routes, and protocol parameters across hybrid and multi-vendor environments, exposing misconfigurations or anomalies that manual inspection can easily miss. Historical comparisons allow teams to see what changed and why, turning reactive firefighting into proactive resolutions.
Beyond EIGRP, NetBrain’s no-code automation details operational knowledge in reusable workflows to enforce consistency and compliance across the network. Its real-time digital twin ensures every decision is based on live data, not assumptions, and every automated action preserves the network’s integrity. NetBrain helps you fix issues faster and remain confident that networks operate safely and predictably.
Turn EIGRP Challenges Into Opportunities
Manual troubleshooting will always be limited, especially with complex protocols like EIGRP. NetBrain shifts the balance by giving you instant visibility, automated diagnosis, and the ability to learn from historical data to prevent issues from returning. The result is not just faster troubleshooting, it is a smarter, more resilient network.
Request a demo today to see how NetBrain can transform how your team troubleshoots and manages your network.