Understand NetBrain UI
NetBrain domain is a workspace as a digital twin of your network, as a subset of a tenant. For end users, the landing page of the domain is displayed as soon as end users login. 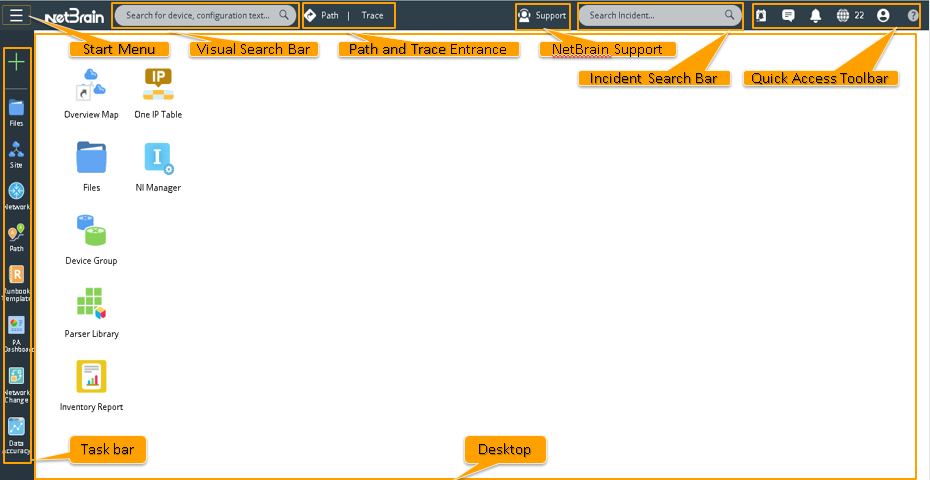
It includes the following UI common components:
- Taskbar
- Start Menu
- Desktop
- Visual Search Bar
- Path and Trace Entrance
- NetBrain Support
- Incident Search Bar
- Quick Access Toolbar
Taskbar
The taskbar is located at the leftmost and includes the following menus.
| Icon | Description |
 | Create a map, dashboard, runbook, data view template, Qapp, parser, Gapp, network change task, network intent or network intent cluster from scratch. See New Map, New Dashboard, New Runbook, New Data View Template, New Qapp, New Gapp, New Parser, New Network Change, New Network Intent or new Network Intent Cluster for more details. |
 | Organize files and folders. See Manage Files for more details. |
 | Browse devices by Site, browse site details, and so on. See Site Pane for more details. |
 | Browse your network resources. See Network Pane for more details. |
 | Browse and manage saved paths. See Path Browser for more details. |
 | Browse and manage runbook templates. See Runbook Template for more details. |
 | Browse your Preventive Automation Dashboard. See PA Dashboard for more details. |
 | Manage network changes in the system. See Manage Network Changes for more details. |
 | Monitor and resolve device accuracy issues. See Manage Data Accuracy for more details. |
Start Menu
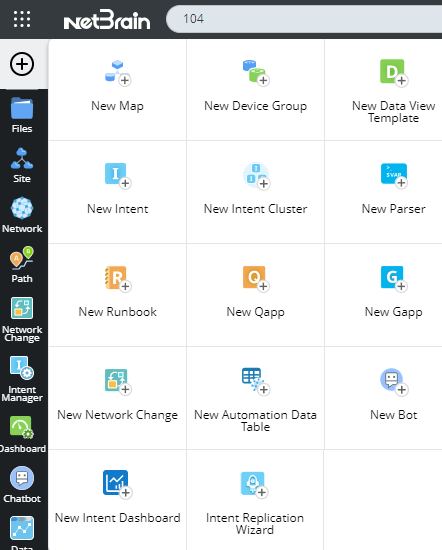
Click the  icon on the top of the taskbar, and then you can access the main NetBrain functions. The start menu opens as follows:
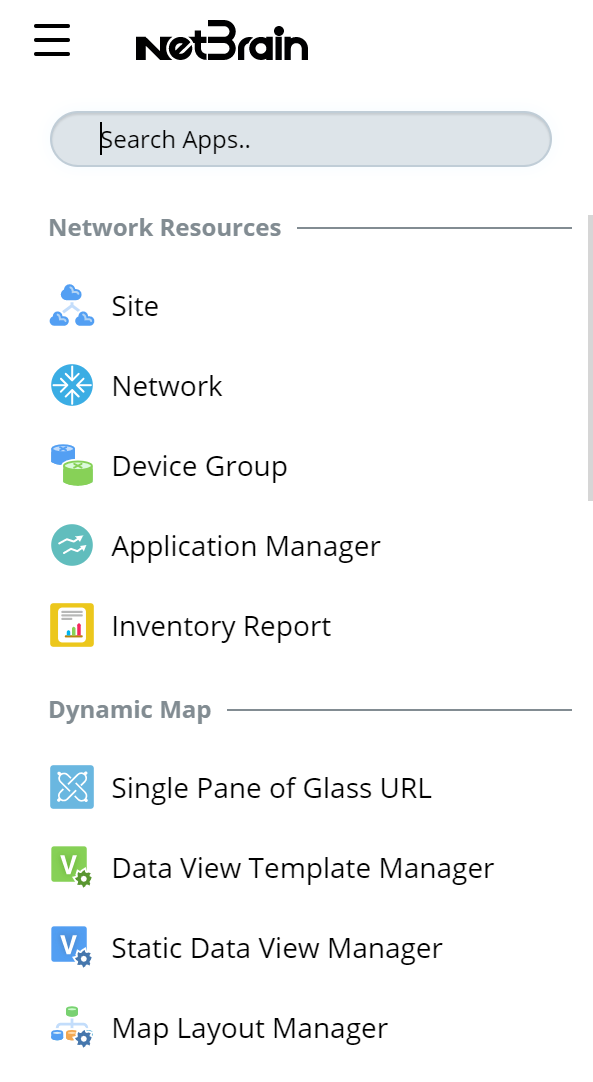

|
Tip: You can click an icon to start the application or click the icon to pin the application to your desktop. And you can search the application from the search bar. icon to pin the application to your desktop. And you can search the application from the search bar.
|
Desktop
Desktop is your personal space to organize your frequently used objects such as maps, device groups and applications and group them into a folder. You can also send file shortcuts or pin applications to the desktop for quick access. See Manage Desktop for more details.
Visual Search Bar
Use NetBrain's powerful search functionality to quickly find the objects in your domain, including devices, maps, paths, sites, and more. You can enter search keywords in the Visual Search Bar to search. See Search for more details.
Path and Trace Entrance
![]()
The Path is a frequently used feature in the NetBrain system. Click Path next to the search bar and enter the source and destination IP address to map the path between them. See Path for details.![]()
The trace entrance is on the first layer of the top bar, and if you click Trace, a new traceroute node will be created in a runbook. You can use Traceroute to discover and map a routing path between two devices or between a Front Server and a device. See Traceroute for more details.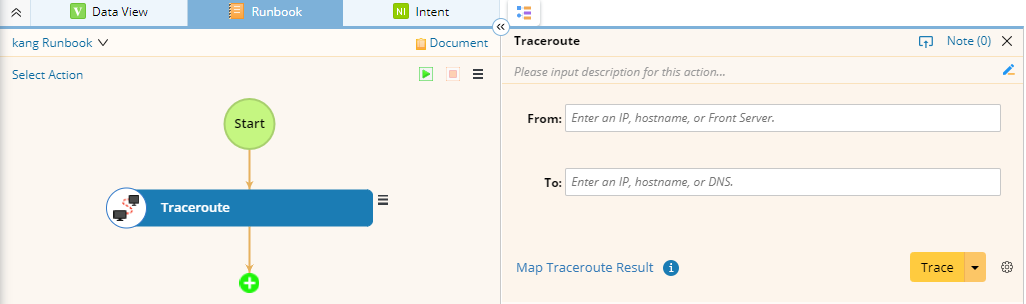
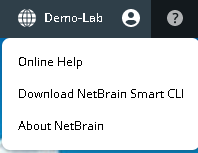
NetBrain Support
You can click ![]() to contact NetBrain support. In the pop-up NetBrain Support window, you can file a new request to NetBrain Support or view the request history.
to contact NetBrain support. In the pop-up NetBrain Support window, you can file a new request to NetBrain Support or view the request history. 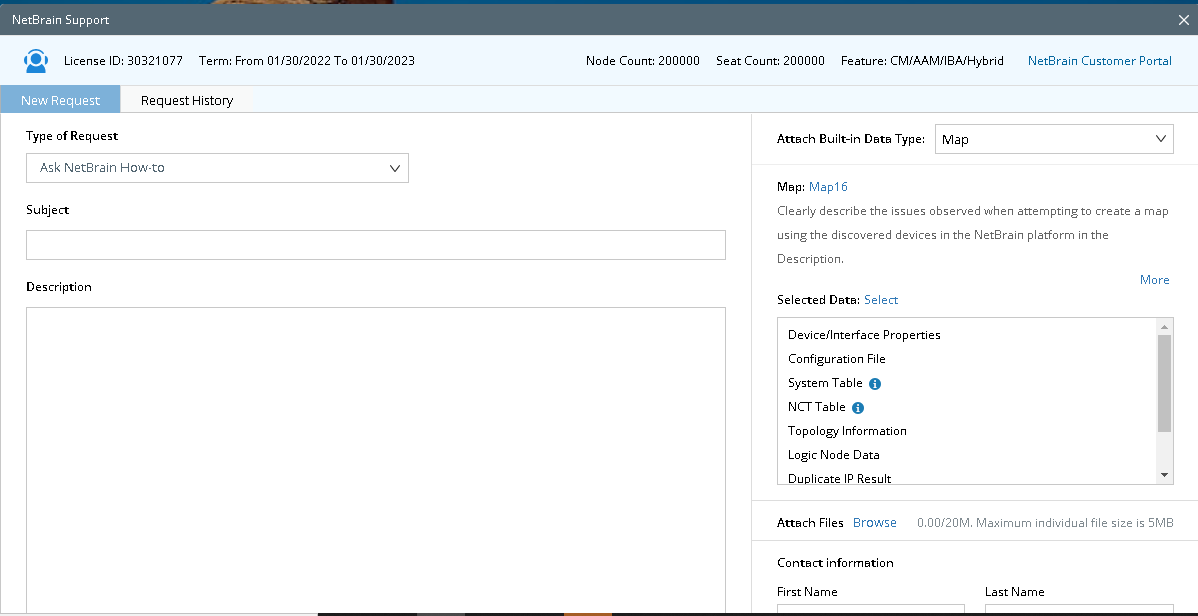
Incident Search Bar
The Incident Search Bar allows you to search incidents in the current domain. Enter search keywords in the Incident Search Bar to search incidents in the current domain. See Work on Incident Pane for more details. 
Quick Access Toolbar
The quick access toolbar is located at the upper-right corner of your Thin Client.![]()
Each icon and menu option on the quick access toolbar is described as follows:
| Icon | Description |
 | Browse incident summary via Incident Quick Access, and you can also operate on a specific incident. |
 | Get notifications for collaboration of map, incident, runbook, change management, dashboard, and function portal suggestion from your colleagues, such as sharing a map or dashboard and transferring editing rights of a map or dashboard. |
 | Get notifications of events, such as errors and warnings in tasks and activities. |
 |
|
 |
|
 |
|
 |
|