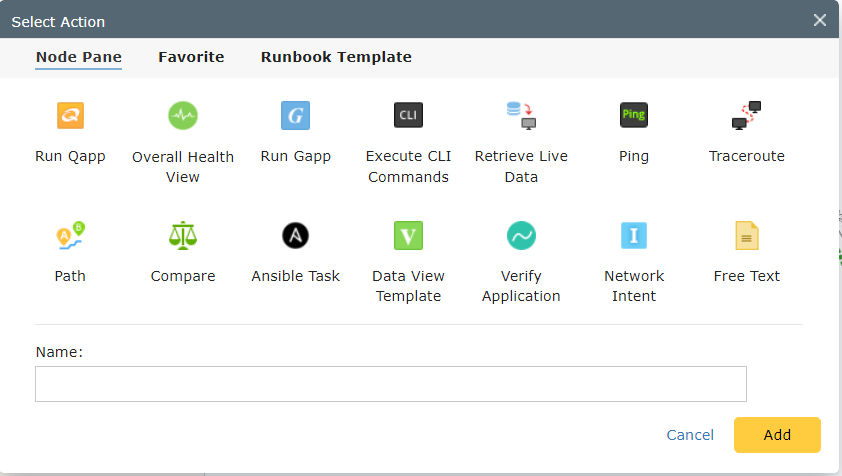
Runbook Actions
Runbooks automates many standard manual network tasks at scale and help network engineers get to the heart of their problems more quickly.
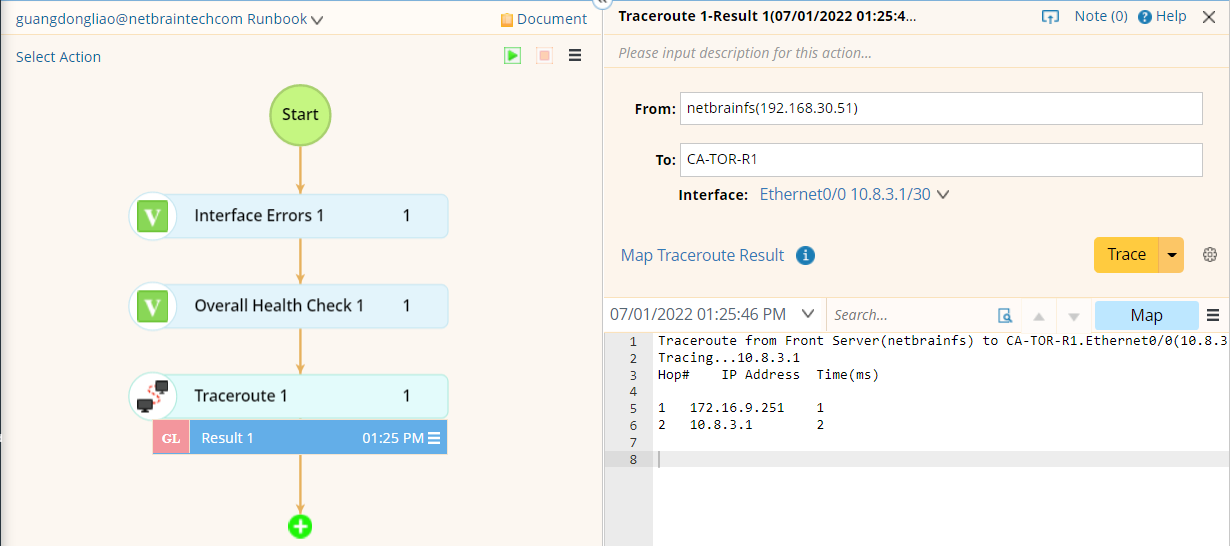
- Ping and Traceroute
Two possible actions in a runbook are commands most engineers are familiar with: Ping and Traceroute. NetBrain will log into the CLI of the device utilized, execute the command with the appropriate parameters, and display the output in a pane for the user to verify.
You can map the traceroute results.
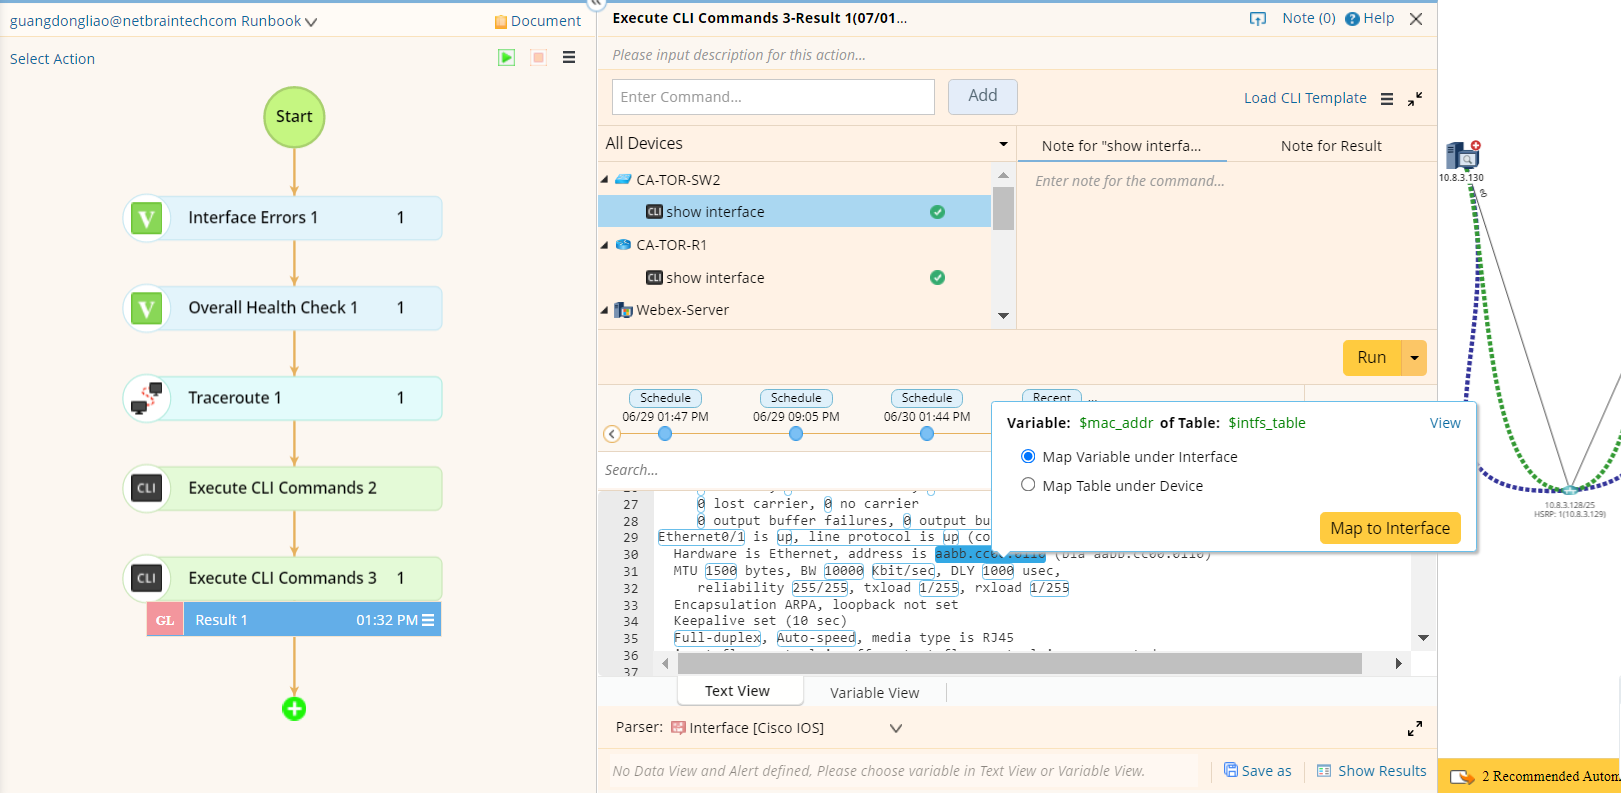
NetBrain can execute individual CLI commands on any number of devices in a Dynamic Map. NetBrain logs into each of these devices to perform CLI commands simultaneously, removing the need for users to hop through individual devices to troubleshoot issues. Multithreaded and real-time, this capability is a critical component in scaling troubleshooting automation.
All historical results are listed for you to compare. You can apply a Parser to see all variables and create a data view template instantly to display the variables in the Map.
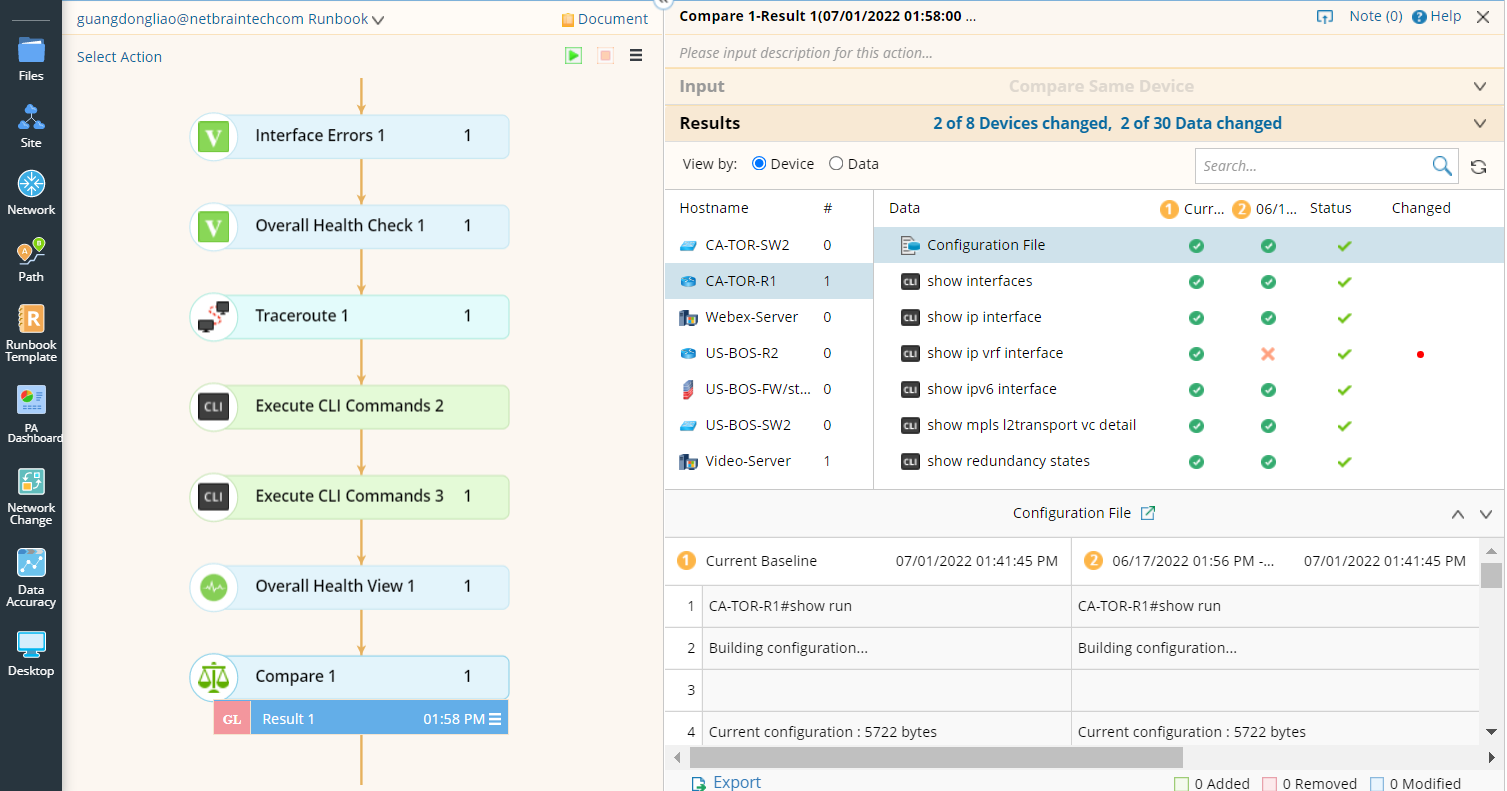
Between 30% and 50% of outages are caused by a network change. Therefore, understanding what’s changed is half the battle during troubleshooting. NetBrain’s benchmarking process will collect and capture pre-defined data on a specified schedule. With the Compare action, you can put live and benchmarked data side by side to see what’s changed.
The overall health View is a built-in DVT that performs a basic diagnosis of every device on a Dynamic Map. Its purpose is to identify common causes of device failure, eliminating time spent manually troubleshooting. Specifically, this DVT analyzes and highlights the following variables:
- CPU Utilization
- Memory Utilization
- Interface up/Down Status
- Input/Output Traffic Utilization
- Interface errors
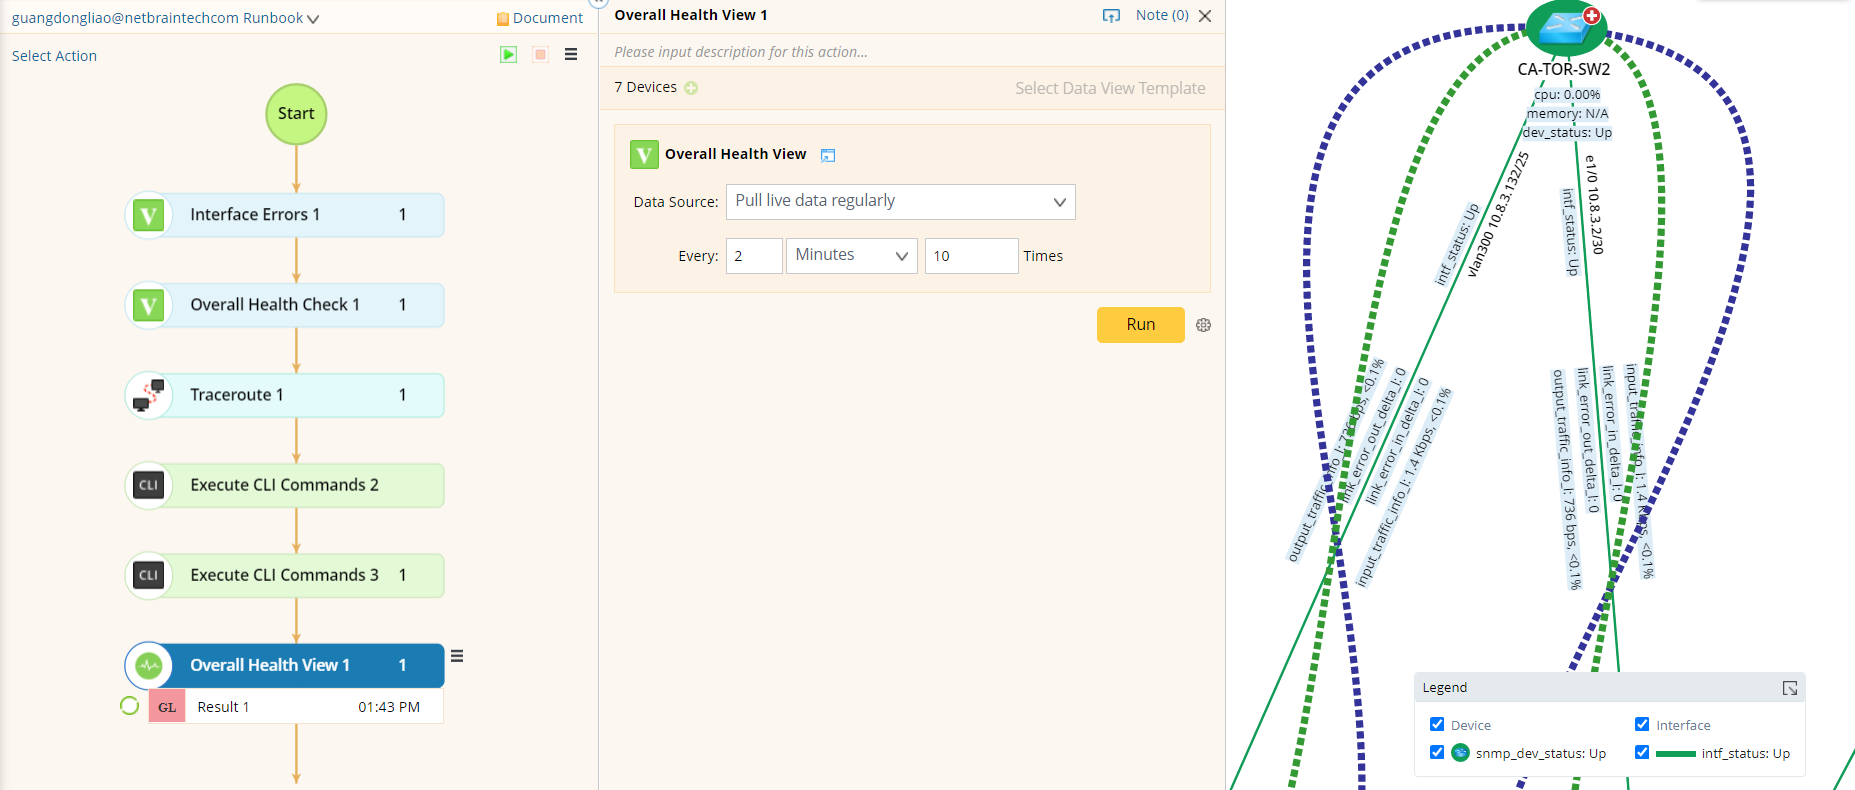
While applying a DVT to the Map, NetBrain will add a DVT node into the Runbook so that the results can be shared.
Designed to replace in-house scripts and automate virtually any network task, NetBrain’s Qapp technology allows users to create on-demand automation that can be written once and executed anywhere. Qapps are customizable programs that pull data from network devices and help engineers draw meaningful insights from the results.
Examples of tasks a Qapp can perform include:
- Detect the duplex and MTU mismatch
- Detect QoS Queue Drops
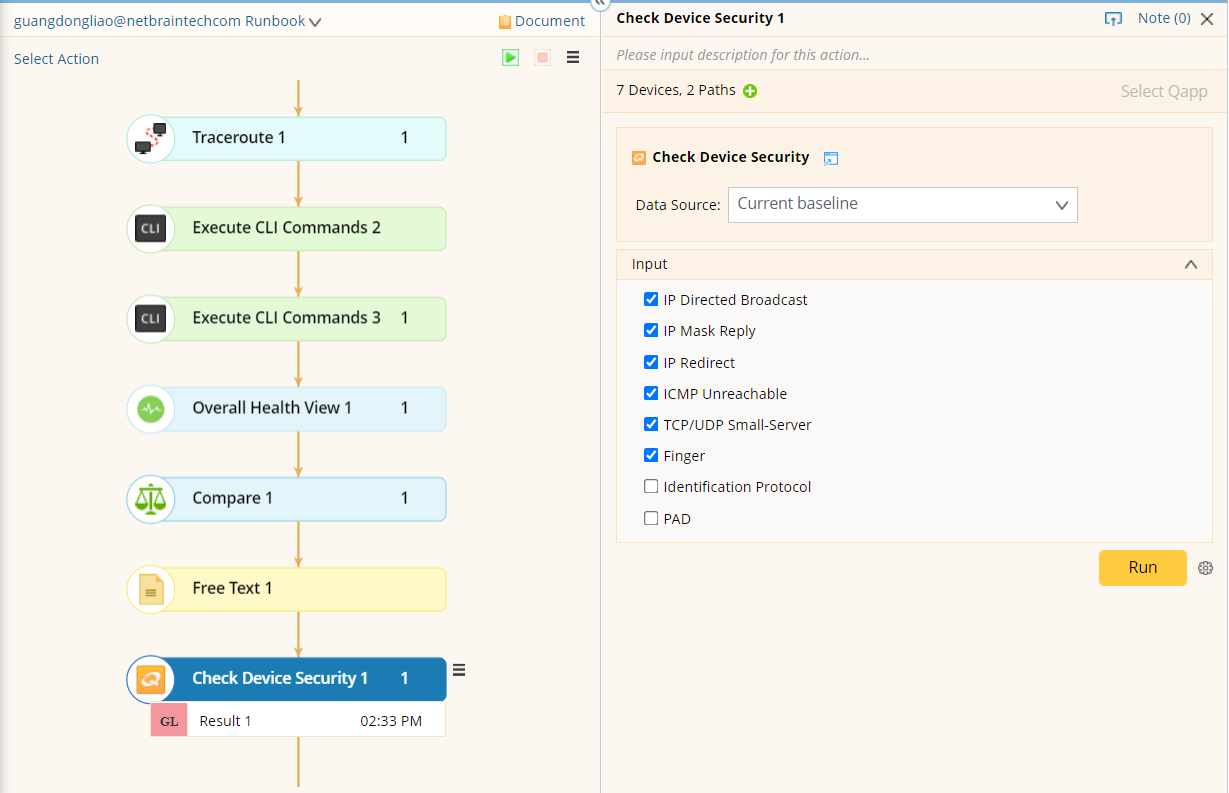
- Run security and compliance checks based on configuration data
Gapps are advanced automation tasks, able to incorporate multiple Qapps together to handle more complex tasks within the network. Gapps string Qapps together with if/then logic, determining whether a Qapp in sequence will execute based on the result of the upstream Qapp.
Gapps help narrow down problem scopes with multi-stage automation and are particularly useful for scheduled tasks: their logic enables complex tasks to be executed without the need for a human operator.
Users can execute an A/B Path between two points and have NetBrain document all network hops between the source and destination, which can be done with historical data to compare the current network status to a benchmark.
Ansible Task node is used to run Ansible Playbook, which can be used to push the configurations to the network devices. The inventory data can be automatically created from the NetBrain data model.

Network Intent (NI) describes a network design for a specific network device, what these design baselines are like, and how to verify the design works properly. NI can be executed interactively as a Runbook node. NI will be described in Network Intent (NI) and Network Intent Cluster (NIC).