2023-Nov-03-R11.1a
Overall Health Monitor
Example: Run Overall Health View on core devices to get key performance metrics (e.g., CPU/MEM usage, interface traffics) via SNMP or API.
-
Add Overall Health View to execute. There are three ways to add it:
-
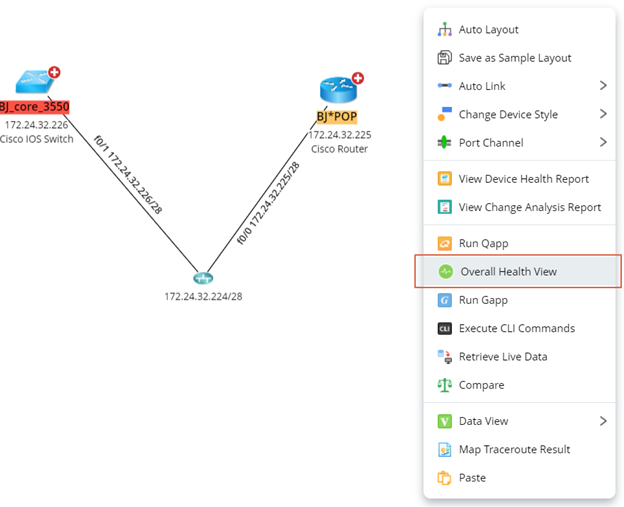
On a map, select Overall Health View from the right-click menu.
-
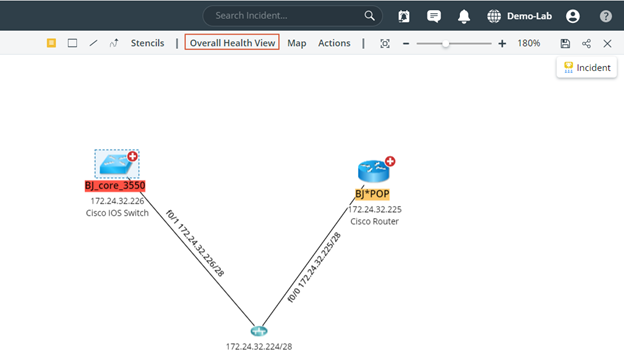
Click Overall Health View from the map toolbar.
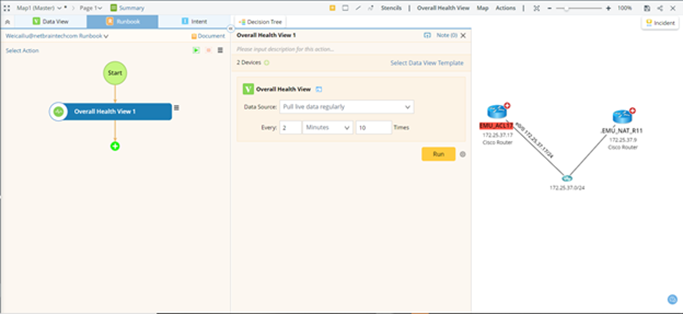
The Runbook pane opens with an Overall Health View action node added.

Tip: To set up a default Data View Template for the Overall Health View, please go to Domain Management > Advanced Setting > Overall Health.
Tip: If a runbook is open, the Overall Health View action will be added to the current Runbook; otherwise, it will be added to the personal runbook.
-
On a map, select Overall Health View from the right-click menu.
-
Before running the Qapp, you can configure the following settings:
-
By default, all devices and paths on the current map are auto-populated.
Note: Data View Template can only be applied to devices on the map, so you cannot add or delete devices. -
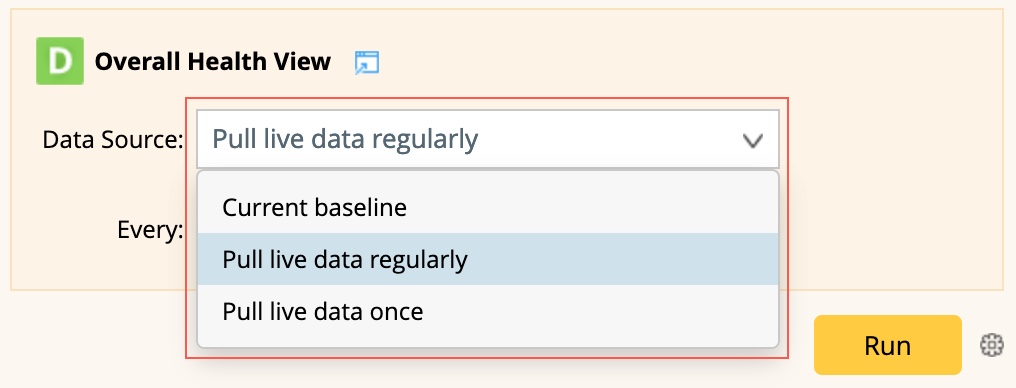
The Pull Live data regularly is the default data source to run the Data View.
-
To share alerts with more users or send alerts via email, click the
 icon next to the Run button.
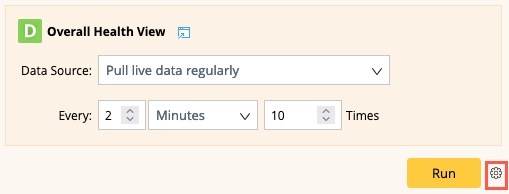
You can also select other data sources to execute as shown in the following picture.
-
By default, all devices and paths on the current map are auto-populated.
-
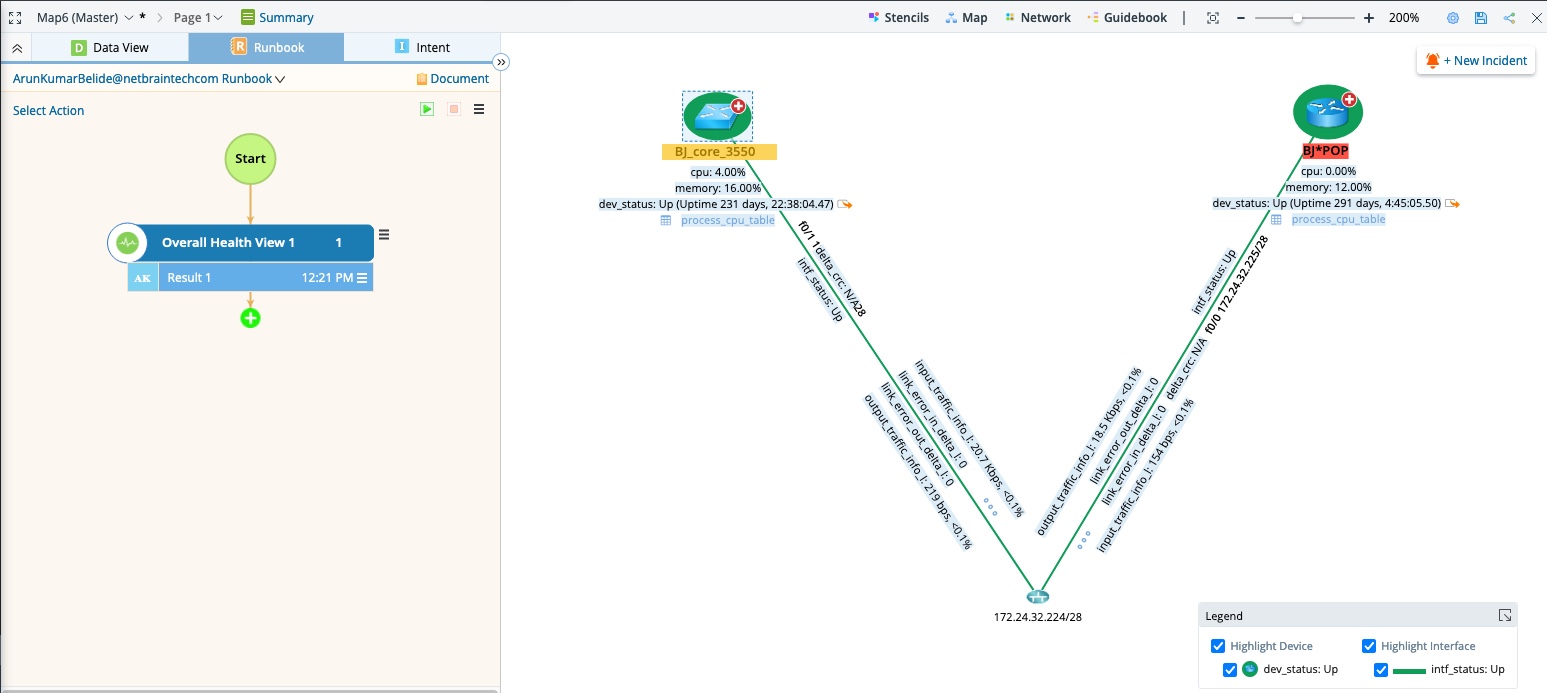
Click Run and view the result on the map.
Tip: To save an action node and its input for reuse, point to the Overall Health View node on the left side of the Runbook, click the  icon next to the node name, and select Save as Favorite.
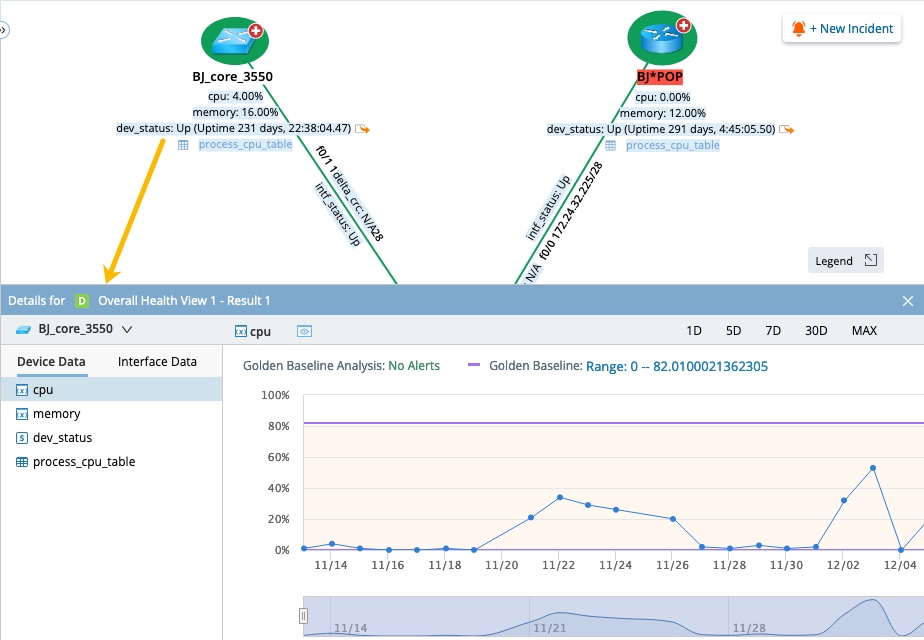
- Click a numeric value on the map. The result pane will expand, and a chart will display the monitoring metrics of this device during a period.
During the monitor process, the color of devices and interfaces may change, indicating the corresponding status described as follows:
| Device Icon | Description |

|
The value of the predefined device variable dev_status is Up. |

|
The value of the predefined device variable dev_status is Down. |
| Link Icon | Description |

|
The value of the predefined interface variable intf_status is Up. |

|
The defined interface variable intf_status is Down. |
| Data Unit Icon | Description |

|
The data unit reaches the predefined threshold of an error alert. |

|
The data unit reaches the predefined threshold of a warning alert. |