PBTF Use Flow
PBTF is designed to help you troubleshoot application-related issues. You can do both Interactive Troubleshooting and Triggered Automation with PBTF.
Path-based Interactive Troubleshooting
Discover and Document the Path when the network is healthy
- Define and discover the path
When you troubleshoot the network issues, your network may not be healthy, and the path may fail. Knowing the path when the network is healthy can speed up troubleshooting. Therefore, you should identify the critical applications, define the path source/destination and their gateway, and discover these paths when the network is healthy.
You can use Path Browser to define the path and Path IP and Fix-up Gateway to define the gateways. Or you can directly map the A/B path and save the path in the Path Browser.

-
Document Path
You can document the calculated paths and related path logic, including:
- Add Path Descriptions
-
Enter Path Note on each hop device to enter the related network design and troubleshooting knowledge.
-
Select Path Reference Map that contains not only path results but also design notes or related config-let, failover annotation, etc. For more information, see Add Reference Map and Device Note.
-
Set a historical Path as the Golden Path, which should be the best traffic path as designed.

-
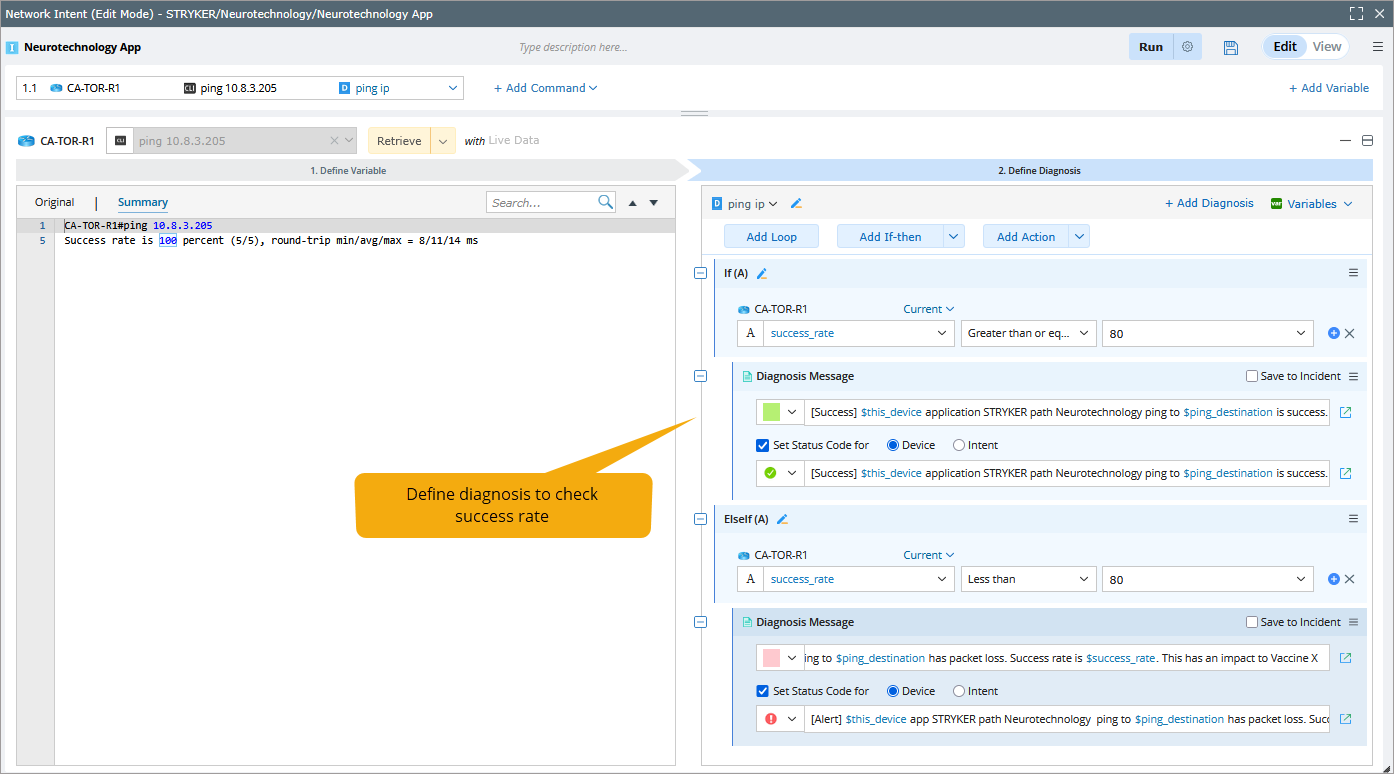
Define Path Intent
You can define a Path Intent to document the diagnosis logic used when the network is healthy. This intent can be associated with a specific network path.
A Network Intent (NI) refers to automation applied to a device or group of devices, based on their local baseline data.
When you define an NI for a path, all devices (or hops) along that path are included in the NI.
This helps diagnose issues such as slow application performance or other path-related problems.Examples of what Path NI can diagnose include:
-
Layer 3 failover (e.g., detecting changes in the next hop)
-
High utilization (e.g., QoS drops, high CPU/memory usage, link errors)
-
Configuration mismatches (e.g., inconsistencies in QoS settings or MTU size)
-
For more information, see Path NI.

Interactive Troubleshooting of Network Issues Using Documented Paths
-
Find and Review Pre-Documented Paths (During Troubleshooting)
When you enter the source and destination in the A/B path UI, the documented path with the same source/destination will be displayed.
You can select one path to view its results on the map, including the Path Description, Note, Path Reference Map, and Path Logic. - Perform Drill-Down Analysis: Calculate live Path and Compare with Cached Path (During troubleshooting)
- Select Golden or Cached Path Results to draw it on the map.

-
Calculate Live Path and compare it with golden Path or cached Path
.

- Visualize the differences on the network map.
- Use this comparison to identify discrepancies such as failover events or routing changes.

Note: If the live path deviates from the cached or golden path, especially under normal network health, it may indicate a failover. This could potentially lead to performance issues (e.g., slower applications due to limited backup link bandwidth).
- Select Golden or Cached Path Results to draw it on the map.
- Execute Path Intent for Deeper Diagnosis (During troubleshooting)
- Open the Incident pane to review alert summary messages generated by Trigger Diagnosis.
- Open the associated Path Network Intent (NI) to view in-depth diagnosis alerts.
- Alternatively, Run the Path NI to retrieve the latest diagnosis data and validate current path behavior.

Path-based Triggered Automation Use Case (Using ADT Intents)
- Discover the Path
- Document the Path (When Network is Healthy)
- Define the Path NI (When Network is Healthy)
- Build Application Path ADT via Application Path.
- Create an additional column group in the same ADT using path-based intent templates.
The resulting ADT will look like the following: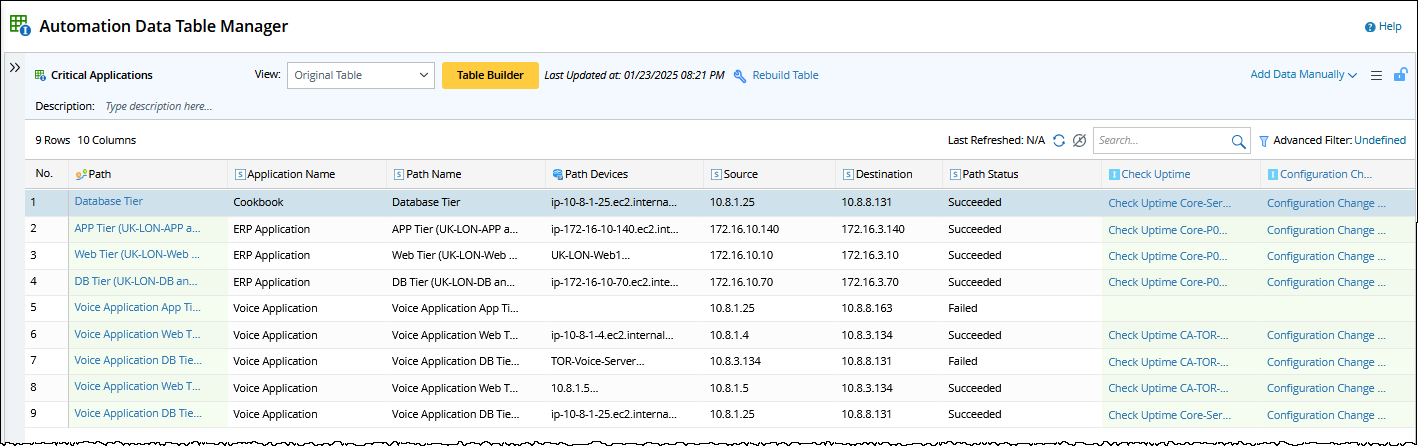
-
Setup ADT-Based Triggered Diagnosis manually (When Network is Healthy).
The ADT intents are triggered by the Triggered Automation Framework (TAF) or the Preventive Automation Framework.
To manually configure triggered diagnosis:- Select Incoming Incident link from the dropdown.
An incident is automatically created for a ServiceNow ticket, based on the TAF definition. You can add the incoming incident type, verify the ticket, and locate the related incident link. - Define conditions to filter relevant incident.
- From the Intent dropdown, select ADT Intents.
- Click Select to choose a created Path Application.
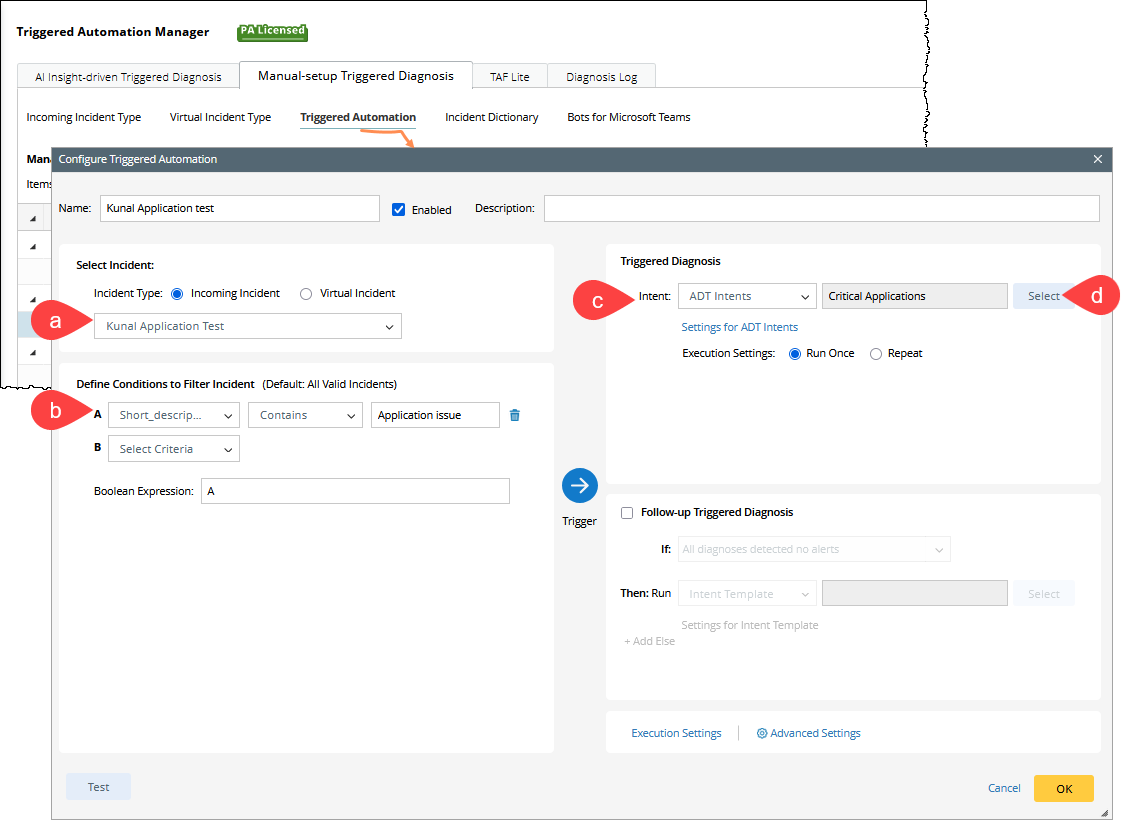
- Select Incoming Incident link from the dropdown.
-
Review the Triggered Diagnosis Results (During troubleshooting)
Go to Diagnosis Log and Search for your Incident ID, and open the corresponding record.
The incident details will open, allowing you to review the results of the triggered diagnosis.
- Drill-down analysis - Calculate live Path and Compare with Cached Path (During troubleshooting)
- Drill-down analysis - Execute Path intent (During troubleshooting)