Exploring Your Domain

Contents
NetBrain domain is a workspace to separate areas, branches, or departments to simplify network management for an enterprise, as a subset of a tenant. The landing page of your domain is displayed as soon as you log in.
It includes the following parts:
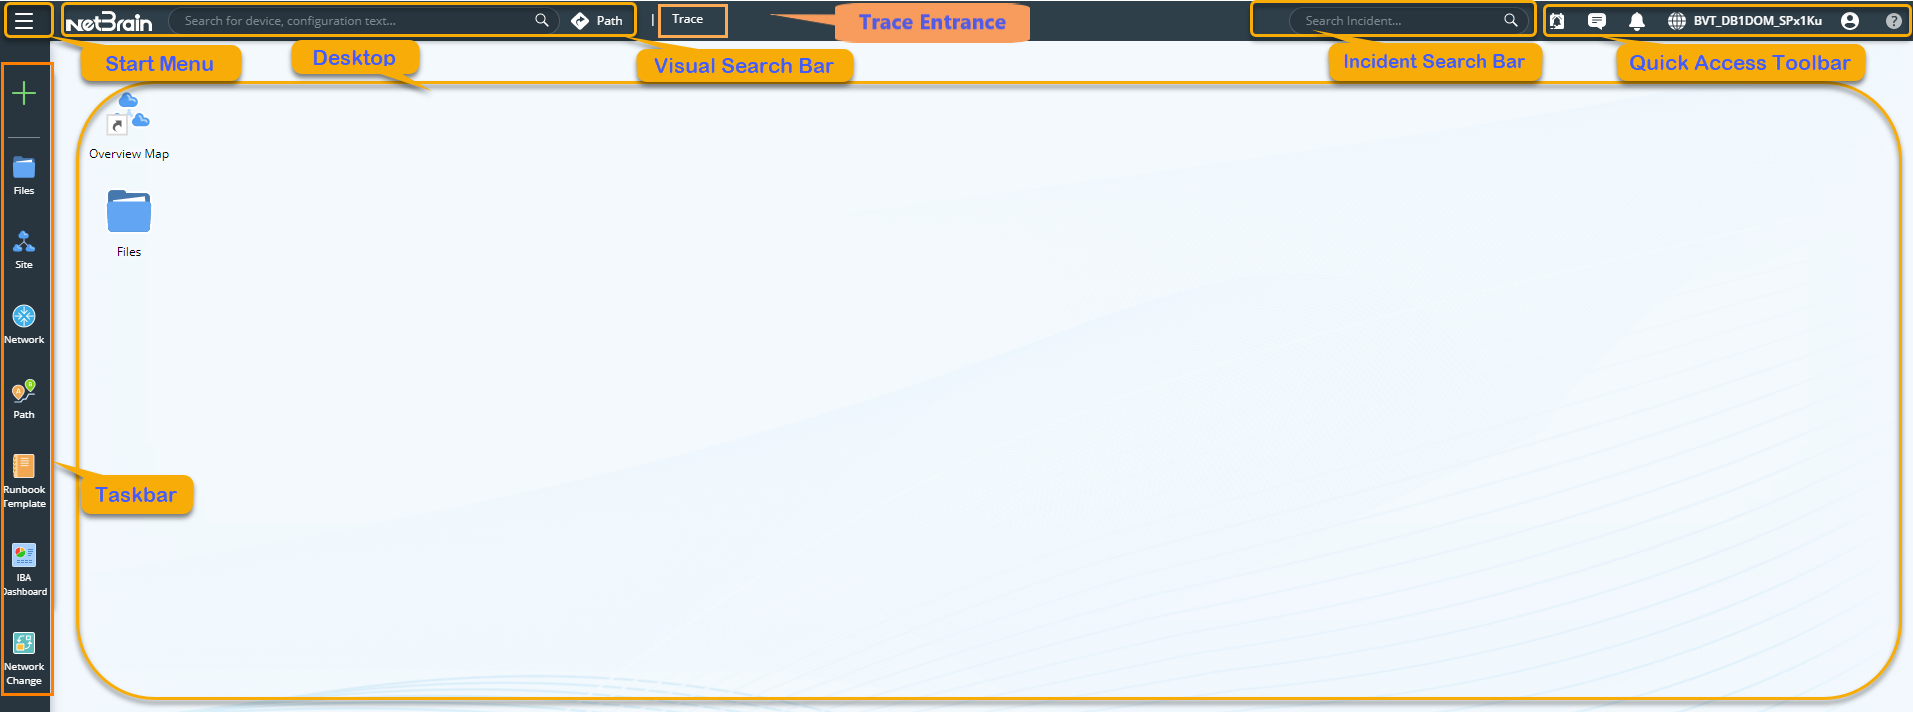
Taskbar
The taskbar is located at the leftmost and includes the following menus.
Icon |
Description |
|---|---|
|
Create a map, dashboard, runbook, data view template, Qapp, parser, Gapp, network change task, or Network Intent from scratch. See New Map, New Dashboard, New Runbook, New Qapp, New Parser, New Gapp, New Network Change Task, or Network Intent for more details. |
|
Organize files and folders. See Files Pane for more details. |
|
Browse devices by site, browse site details, and so on. See Site Pane for more details. |
|
Browse your network resources. See Network Pane for more details. |
|
Browse and manage saved paths. See Path Browser for more details. |
|
Browse and manage runbook templates. See Runbook Template for more details. |
|
Manage network changes in the system. See Managing Network Changes for more details. |

Start Menu
Click the  icon on the top of the taskbar, and then you can access the main NetBrain functions. The start menu opens as follows:
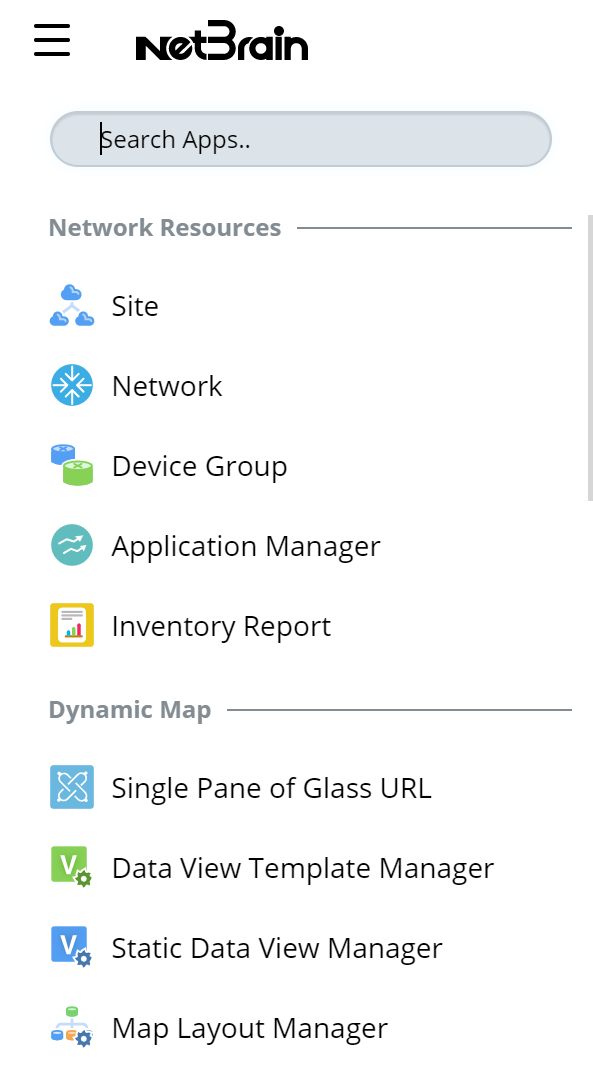
You can click an icon to start the application, or click the ![]() icon to pin the application to your desktop.
icon to pin the application to your desktop.
Desktop
Desktop is your personal space to visually organize your frequently used map files, and dashboard files and group them into a folder. You can also send file shortcuts or pin applications to the desktop for quick access. See Desktop for more details.
Visual Search Bar and Path Calculation Mode
Use NetBrain's powerful search functionality to quickly find the objects that you are interested in in your domain, including devices, maps, paths, sites, and much more. See Search for more details.

Click Path to switch the Visual Search Bar to path calculation mode.

Trace Entrance
The trace entrance is on the first layer of the top bar, and if you click Trace, a new traceroute node will be created in a runbook.

Quick Access Toolbar
The quick access toolbar is located at the upper-right corner of your Thin Client.

Each icon and menu option are described as follows:
Icon |
Description |
|---|---|
|
Browse incident summary via Incident Quick Access,and you can also operate on a specific incident. |
|
Get notifications for collaboration of map, incident, runbook, change management, and dashboard, and suggestion of function portal from your colleagues, such as sharing a map or dashboard, and transfering editing rights of a map or dashboard. |
|
Get notifications of events, such as errors and warnings in tasks and activities. |
|
▪User Profile — maintain your personal information. ▪Change Password — available only if you select the corresponding check box while adding or editing your User Account. ▪User Preference — you can set up User Preference to define the behavior of double-clicking a device and whether scrolling the mouse wheel to zoom in/out a map requires pressing the Ctrl key. ▪Log Out — end the current user session. |
|
▪Click Select Domain to go to more tenants and domains, or create your domain. ▪The hyperlink Domain Management is available only if you have the role of the domain administrator, or the privileges of domain management. |
|
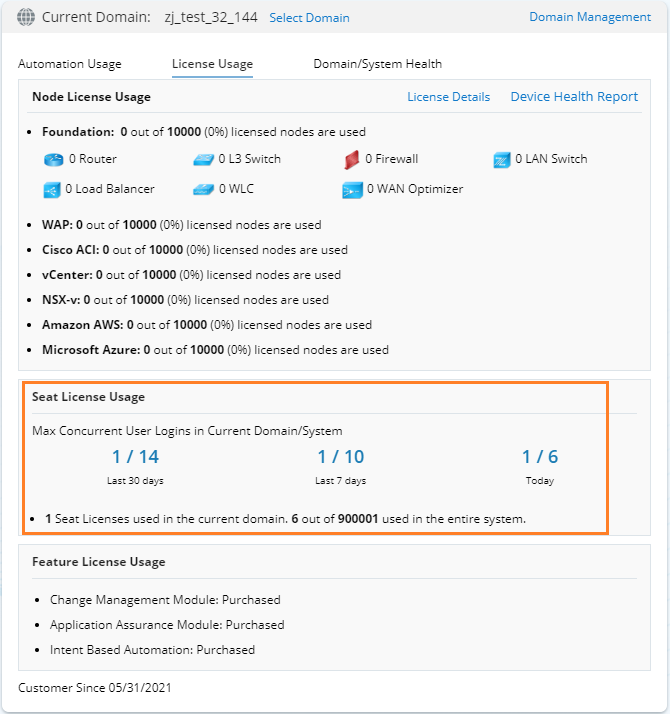
▪Automation Usage — Get to see the parameters of user login, triggered automation, interactive automation, proactive automation and intent execution. You can click Email Report to configure the email settings to get reports as required. ▪License Usage — Get to know the licensed node count and consumed node count by device type, as well as the licensed seat count. You can view the report about the max concurrent user logins for today, the last 7 days, and the last 30 days at the domain and system-level separately. ▪Domain/ System Health — Monitor NetBrain servers and services. It is available only when Service Monitor Agent is installed. See Monitoring Servers and Services for more details. You can also see Domain Health Report. |
|
▪Help — visit online help. ▪Contact NetBrain — reach out to NetBrain Support Team for help. ▪Support — redirect to NetBrain Website for further support. ▪Download NetBrain Smart CLI — click to download the Smart CLI tool. ▪About NetBrain — view version number and legal notice. |