View Domain Health Report

Contents
Domain Health Report records the key factors about domain health. You can get a quick overview of the current domain status with this report.
1.Log in to the Domain Management page.
2.In the Domain Management page, select Operations > Domain Health Report from the quick access toolbar.
3.In the Domain Health Report tab, click Create Health Report to generate a report.
4.View the highlighted area to get an overview.
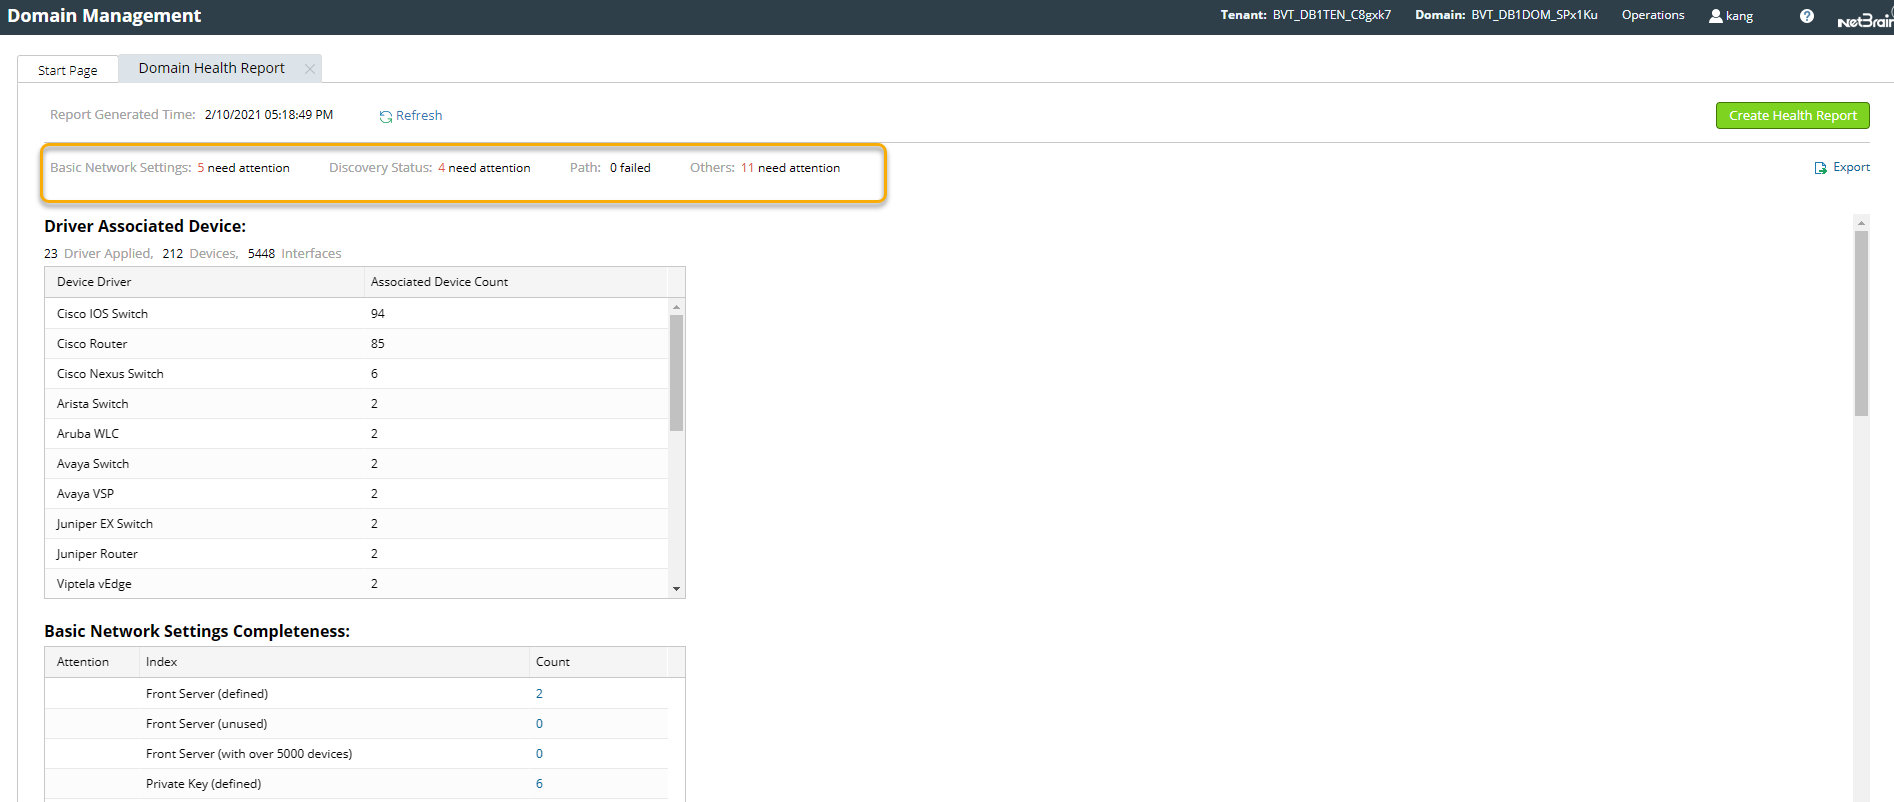
5.Check the following areas to get more information.
▪Basic Network Settings Completeness
▪Disk Management Settings Completeness
▪Map Layout Settings Completeness
Driver Associated Device
The following table displays the count of devices discovered by corresponding drivers. Device driver defines the method of retrieving and parsing device data during live access.
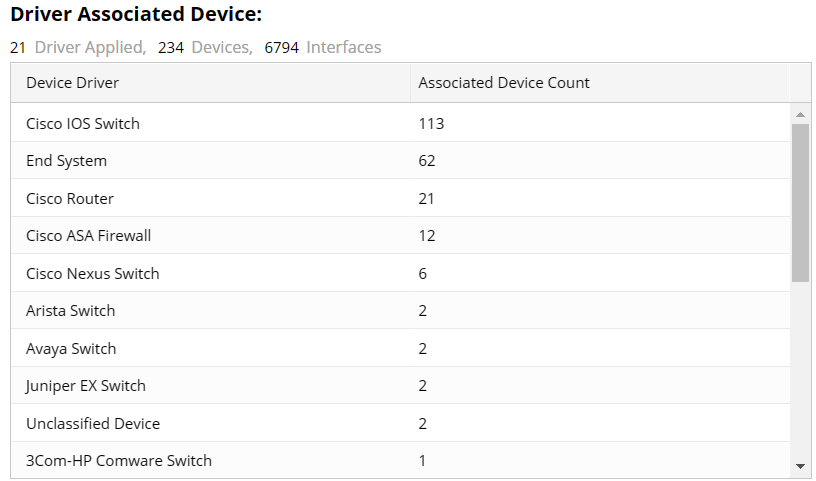
Note: See Device Driver for more details.
Basic Network Settings Completeness
The table lists the information in Network Settings, API Server Manager, and CheckPoint OPSEC Manager.
Index |
Description |
Condition Calls for Attention |
Front Server (defined) |
The count of stand-alone Front Server served in a domain |
count = 0 |
Front Server (unused) |
The count of stand-alone Front Server that is allocated with 0 device |
count > 0 |
Front Server (with over 5000 devices) |
The count of stand-alone Front Server that is allocated with more than 5000 devices |
count > 0 |
Front Server Group (defined) |
The count of Front Server Group served in a domain |
N/A |
Front Server Group (unused) |
The count of Front Server Group that is allocated with 0 device |
count > 0 |
Front Server Group (with over 5000 devices per Front Server) |
The count of Front Server Group that is allocated with more than 5000 devices |
count > 0 |
***1) (defined) |
The count of defined *** |
count = 0 |
***1) (unused) |
The count of *** with 0 device |
count > 0 |
API Server |
The count of defined API Server |
N/A |
CheckPoint OPSEC |
The count of defined CheckPoint OPSEC |
▪count = 0 when there is CheckPoint R77 in a domain ▪No mark required when where is no CheckPoint R77 in a domain |
Note: 1) *** represents Private Key, Jumpbox, Telnet/SSH Login, Privilege Login, and SNMP String.
Discovery Status
The table lists the discovered device summary and licensed node usage.
Index |
Description |
Condition Calls for Attention |
Licensed Node Usage |
The usage of license |
N/A |
Fully CLI-Accessed Rate |
The rate represents the percentage of Fully CLI-Accessed Devices among All Discovered Devices, except Don't Support CLI devices and other devices. |
N/A |
Fully CLI-Accessed Devices |
The devices that the system discovered via CLI. |
N/A |
SNMP-Only Devices |
The count of devices in Fine Tune > All Discovered Devices > SNMP-Only Devices |
count > 0 |
Unknown SNMP SysObjectID |
The count of SysObjectID in Fine Tune > Unknown SNMP SysObjectID |
count > 0 |
Unknown IP |
The count of IP addresses in Fine Tune > Unknown IP |
count > 0 |
Missed Devices |
The count of devices in Fine Tune > Missed Devices |
count > 0 |
Subnet with Conflicted IPs |
The count of subnets in Fine Tune > Duplicated IP and Subnet Manager when All Zones is selected |
count > 0 |
Zone |
The count of Zones in Fine Tune > Duplicated IP and Subnet Manager |
count = 0 Note: Because of the existence of Default Zone, the count of Zone cannot be equal to 0. |
Hostname Change |
The count of devices with hostname changed in Fine Tune > Hostname Change. |
count > 0 |
Site Definition Completeness
The table lists the summary of site information.
Index |
Description |
Condition Calls for Attention |
|---|---|---|
Container Site |
The count of Container Site |
N/A |
Leaf Site |
The count of Leaf Site |
N/A |
Leaf Site (with 0 device) |
The count of Leaf Site with 0 device |
count > 0 |
Leaf Site (over 100 devices) |
The count of Leaf Site with more than 100 devices |
count > 0 |
Unassigned Device |
The count of unassigned devices |
count > 0 |
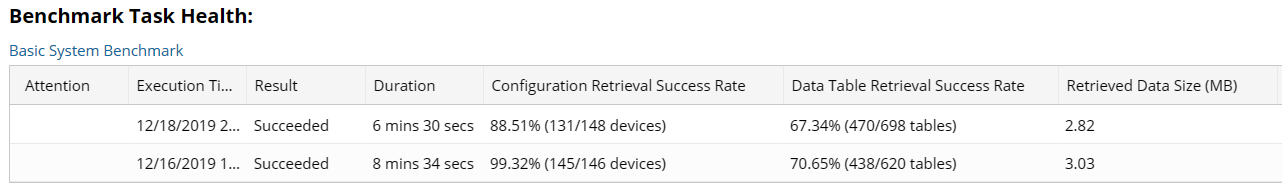
Benchmark Task Health
The benchmarks whose results display as Succeeded with Warning or Failed will be marked with  in Attention column.
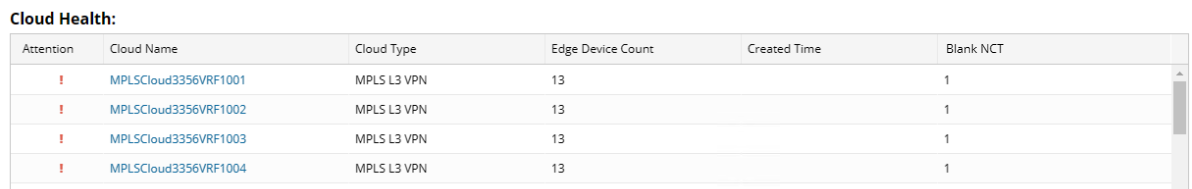
Cloud Health
This area shows the basic information of the existing clouds in the current domain. Blank NCT includes those tables with headers only. When the count of blank NCT exceeds 0, the attention icon ![]() will display.
will display.
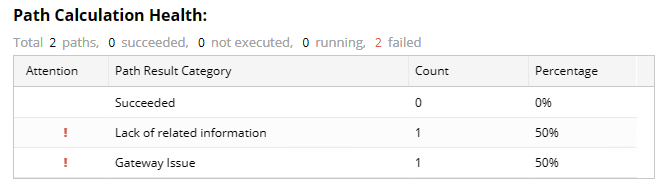
Path Calculation Health
This area shows the summary of path calculation, such as the count of total paths, the count of paths that are successfully calculated, and the count of paths that are not calculated. The status pane is categorized by Succeeded and the causes of failure.
Disk Management Settings Completeness
Global Data Clean Settings
The table lists whether the data in Global Data Clean Settings is enabled or not.
Index |
Condition Calls for Attention |
Data Engine Data |
Disabled |
Qapp/Gapp Execution Logs |
Disabled |
One-IP Table Entries |
Disabled |
Discovery/Benchmark Logs |
Disabled |
Application Path History Data |
Disabled |
DataUnitStorage |
Disabled |
Backup Maps |
Disabled |
API Triggered Automation Task |
Disabled |
Event Entries in Every Console |
Disabled |
Execution Logs for Scheduled Data View Template and Parser Tasks |
Disabled |
Dashboard Activity Data Table |
Disabled |
Compare Results |
Enabled |
MongoDB Disk Alert Rules: (System Settings)
The table lists the settings of MongoDB Disk Alert Rules in Service Monitor.
Index |
Description |
Condition Calls for Attention |
Send emails when alert detected |
Whether to be enabled |
Disabled |
Send emails and delete Data Engine data when alert detected |
Whether to be enabled |
Disabled |
Send emails and disable write permission to MongoDB when alert detected |
Whether to be enabled |
Disabled |
Email Address |
Whether to be configured |
When the Email Address is not configured and at least one of the above rules is configured. Note: If Email Address is configured, status is Configured, if not, status is None. |
Map Layout Settings Completeness
The table lists the information in Map Layout Manager.
Index |
Description |
Condition Calls for Attention |
Customized Layout |
The count of customized layouts in Layout Styles and Sample Maps, except for built-in layouts |
count = 0 |
Devices with Tags Associated |
The count of devices with tags assigned |
N/A |
Devices without Tags Associated |
The count of devices without tags assigned |
count > 0 |
Site Maps with Layouts Associated |
The count of sits maps with layouts associated |
N/A |
Site Maps without Layouts Associated |
The count of sits maps without layouts associated |
count > 0 |