Monitoring Server and Service Metrics

Contents
NetBrain Service Monitor provides a portal for administrators to observe the health of deployed Windows and Linux servers, with operations management of related services. It collects various types of metrics data from these deployed servers and visualizes them in tables or line charts.
Note: The Service Monitor Agent must be installed on the servers that you want to monitor. If you deploy more than one system across multiple data centers, you will have more than one Service Monitor portal.
Note: System upgrade feature heavily relies on all the NetBrain servers and service metrics, therefore it is required to ensure all the NetBrain servers and component metrics can be viewed in the Service Monitor page.
To monitor server and service metrics:
1.In the System Management page, click the  start menu > Service Monitor.
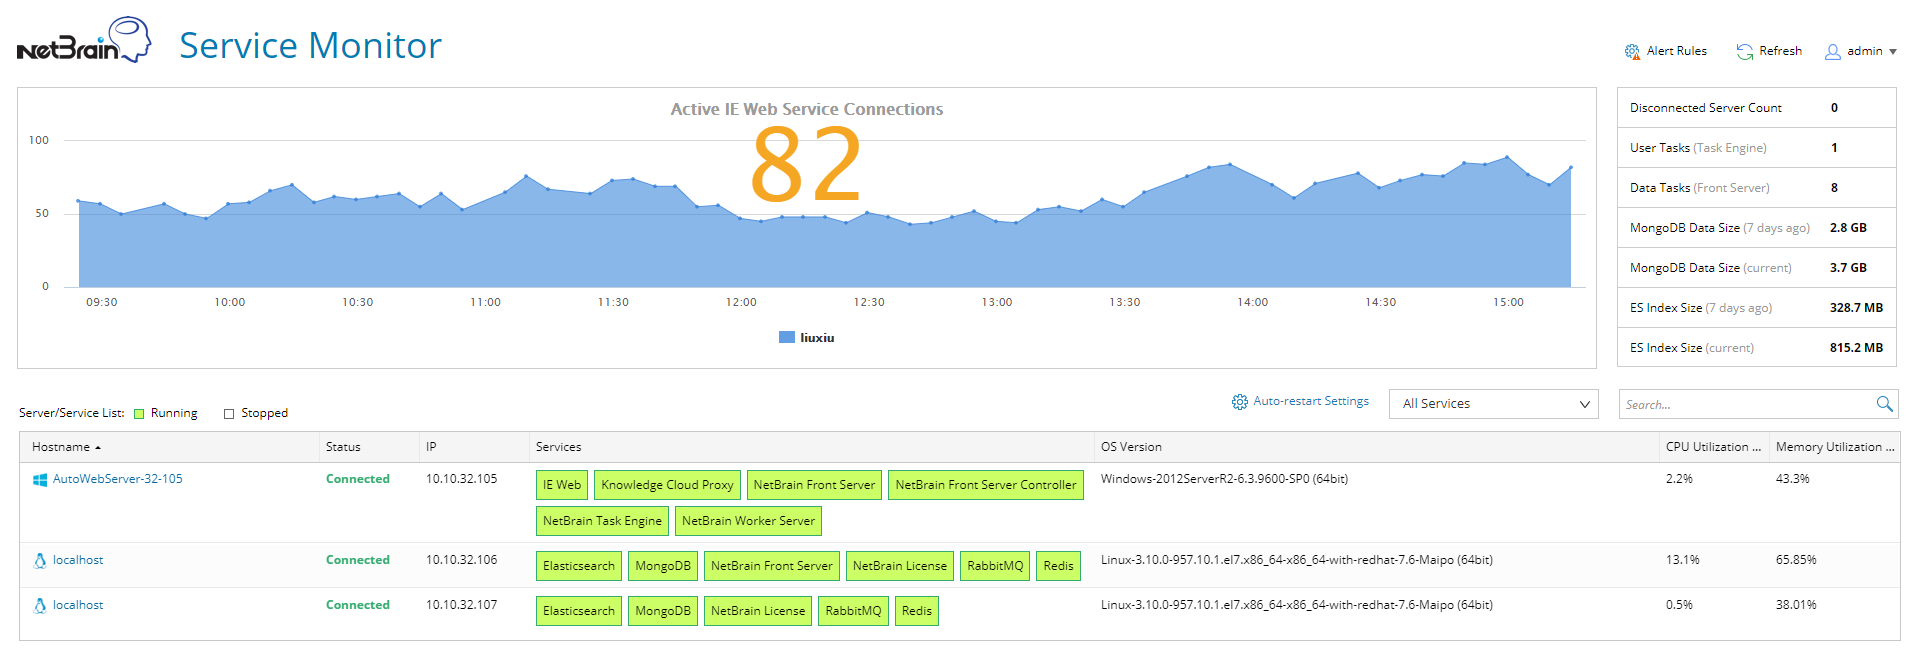
2.In the Service Monitor home page, you can monitor key server metrics, server connectivity, resource utilization, service status and so on.
3.Customize the conditions for when to send out alert emails and take more actions for low disk space on MongoDB by clicking Alert Rules. See Managing Alert Rules for more details.
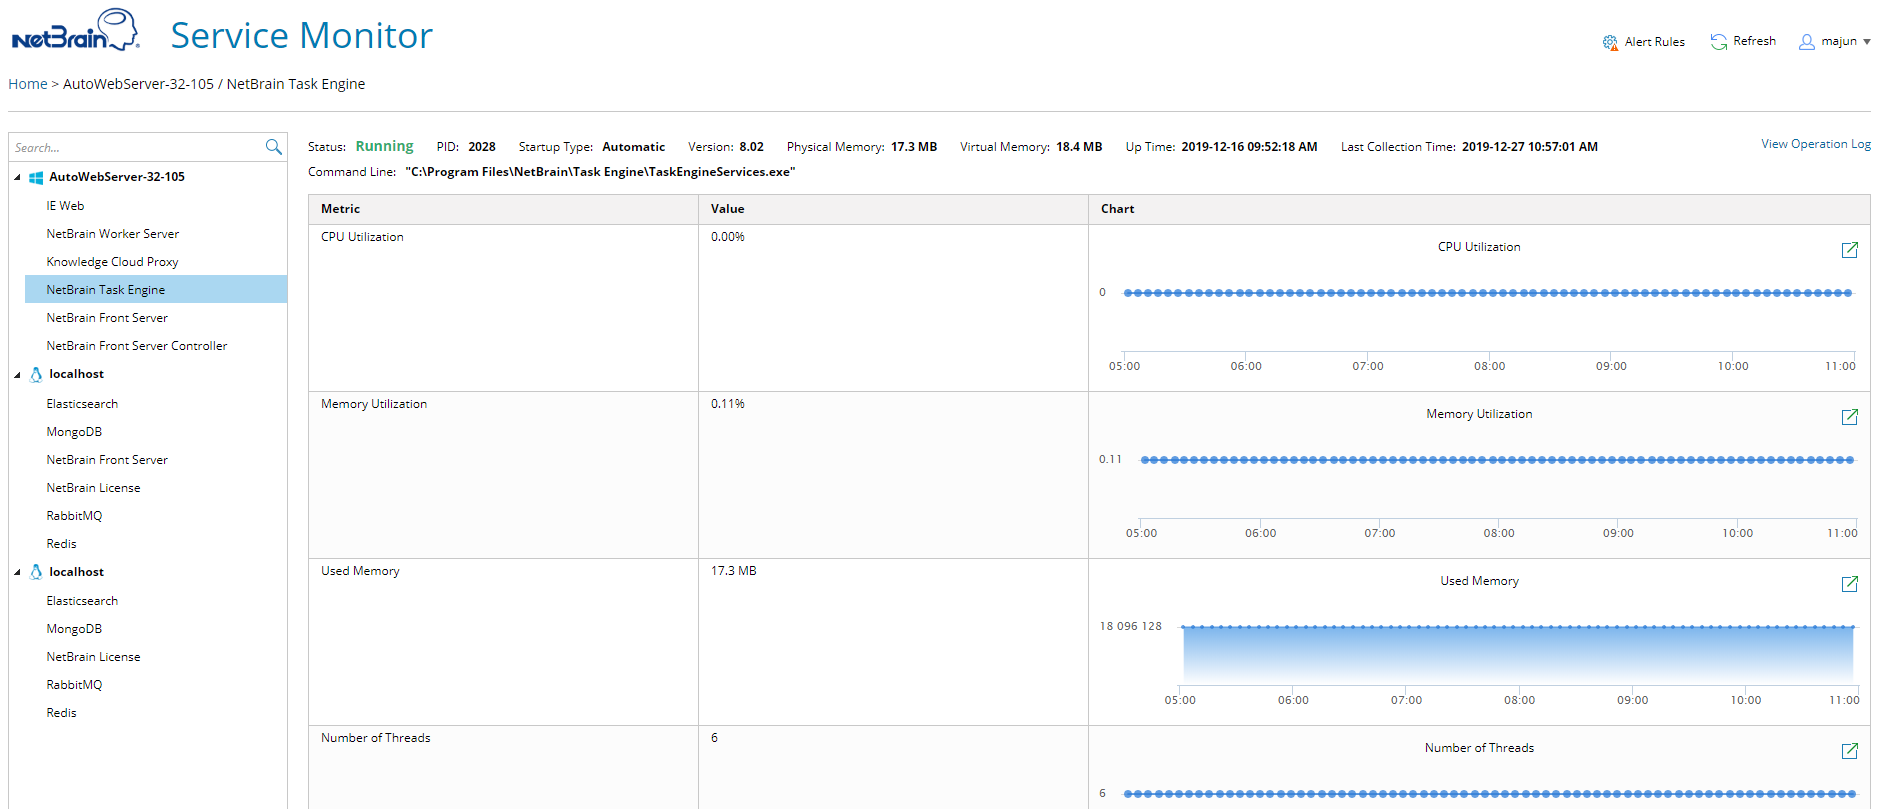
4.To check detailed metrics for a specific service, click the service name to view details. See Service Metrics for more reference. By default, the system collects metric data every 5 minutes and refresh the page every 5 minutes to display the latest metric data.
See also: