Using Data View to Decode Network Design
Data View is a layer-based data structure to organize and display various device information, which is mainly used to decode the static design of a network. By demonstrating automation data or third-party data, dynamic map powered by data view can serve as the single pane of glass for all your network data.
A group of data views having the same name can not only represent a "network design", such as OSPF design, BGP design, and multicasting design, but also represent a "troubleshoot scenario", such as checking QoS queue congestion, and checking interface errors. You can apply multiple data views on a map to show more layers of network data for the following purposes:
▪Share network design knowledge
▪Trace network changes
▪Monitor network performance and security
▪Troubleshoot network issues
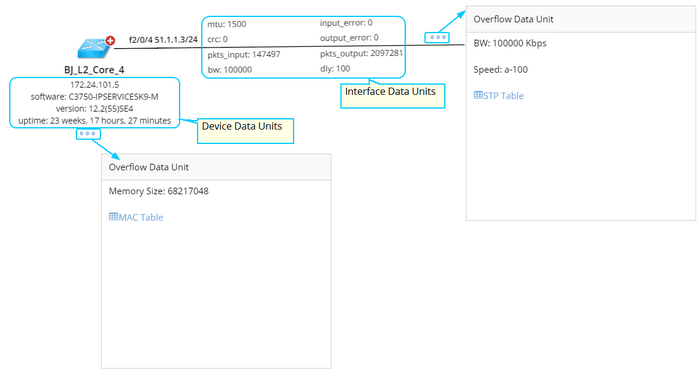
Example: A data view displays the maintenance information on device positions and CRC information on interface positions.

Use Case
▪Decode Network Design
Apply a global data view on a map, and continuously edit the data view to make the visualized network data more valuable.
▪Single Pane of Glass
The system can retrieve data from third-party systems via APIs, and visualize the data through data views on a map. After creating a data view template with API parser, you can apply it and click a specific web link on the data view to directly go to third-party system for drill-down investigations and operations.
See also:
▪Multiple Ways to Generate Data Views
