Viewing Adaptive Monitoring Results

Contents
After the adaptive monitoring and the triggered automation are properly defined, the system will execute the flash probe based on the defined frequency. If an alert is detected by flash probe, the network intent will be further executed. To view the adaptive monitoring results, you can use the execution tree or adaptive monitoring data view/trend chart.
Execution Tree
Execution tree provides troubleshooting knowledge and results based on a single device. The results are organized by types of troubleshooting knowledges.
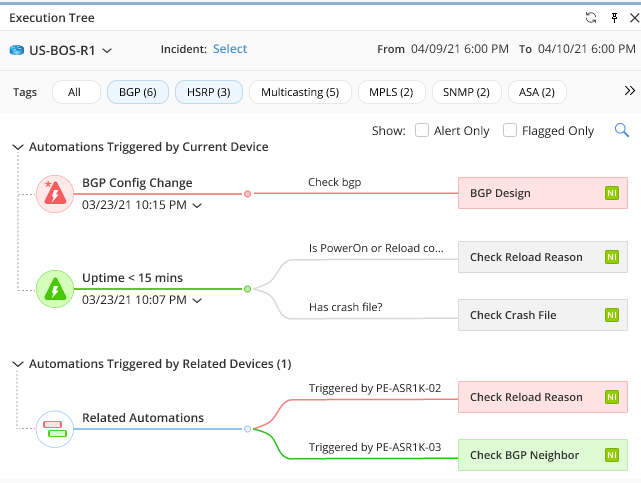
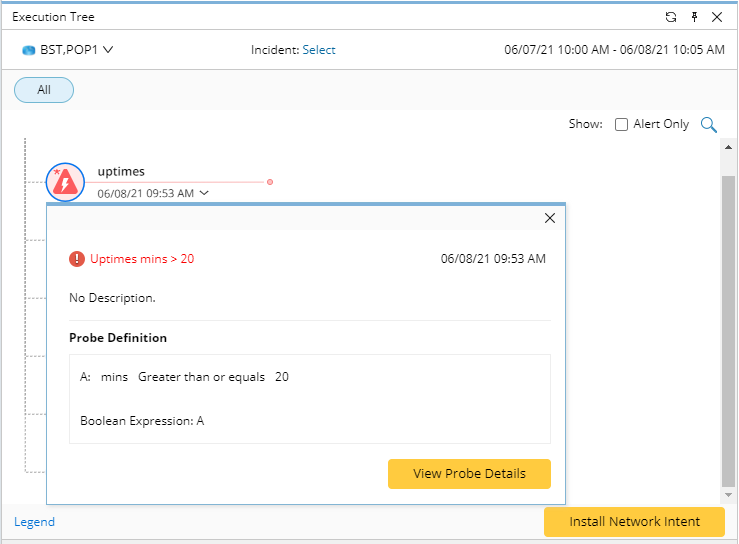
•View the latest flash probe results: Click on the probe icon, the latest flash probe results can be viewed.
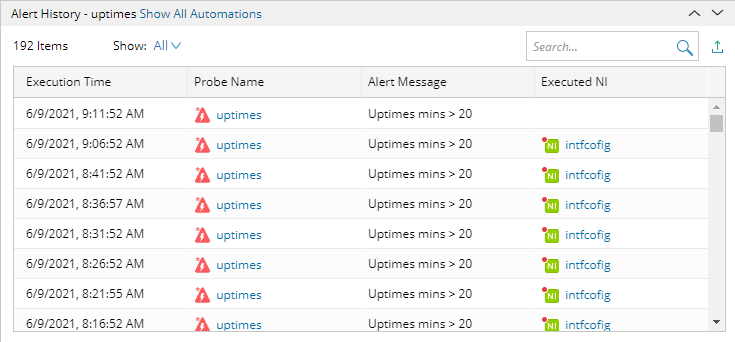
•View the Alert History of the probe: Click on the probe icon, the alert history of the probe will be shown below the Execution Tree.
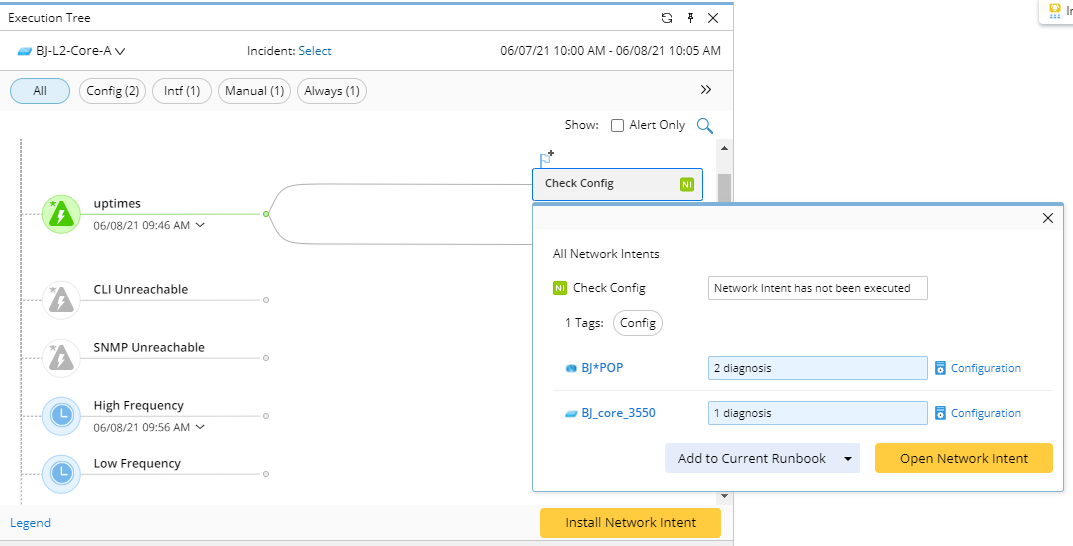
•View network intent results: network intent execution results can be viewed from triggered automation results.
Refer to Viewing and Understanding Execution Tree to learn more about Execution Tree.
Monitoring Data View and Trend Chart
Monitoring Data View and Trend Chart demonstrates the adaptive monitoring results on the dynamic map:
•Monitoring Data View – A special Data View demonstrating the results of Flash Probe and the Monitoring Variable defined in the Adaptive Monitor. You can customize the visual appearance of these results for each device in the dynamic map.
•Trend Chart – A diagram displaying the historical data of Flash Probe, Monitoring Variable, as well as the previous execution results of triggered automation. You can activate the trend chart from either Execution Tree or Monitoring Data View.

Refer to the following topics for more details about Monitoring Data View & Trend Chart:
•Viewing Flash Probe and Monitoring Variable in Monitoring Data View Pane
•Viewing Customized Data Unit in Monitoring Data View
•Using Trend Chart to View Historical Data
•Using Trend Chart to Change Map Time for Monitoring Data View