Using Trend Chart to Change Map Time for Monitoring Data View

Contents
You can set a historical time point as the map time to change the result of Flash Probe or Monitoring Variable displayed on map. When the map time changes, the results of Flash Probe and Monitoring Variable will vary to match the newly defined map time. This way you can easily check the critical data of all map devices at different historical time points to better understand the historical status of your network.
After clicking an interested execution time point of the Flash Probe or Monitoring Variable in Trend Chart, the Set Map Time button will become available.
Flash Probe
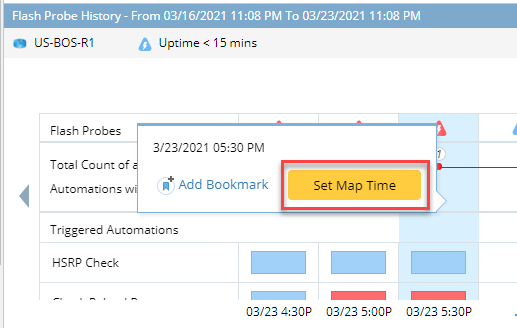
Grouped execution time can be selected from the dropdown list that includes all the available execution time points.

String Variable

Table Variable
Number Variable

Current Map Time in Trend Chart
Flash Probe
The map time is visualized as a black vertical line in Trend Chart.
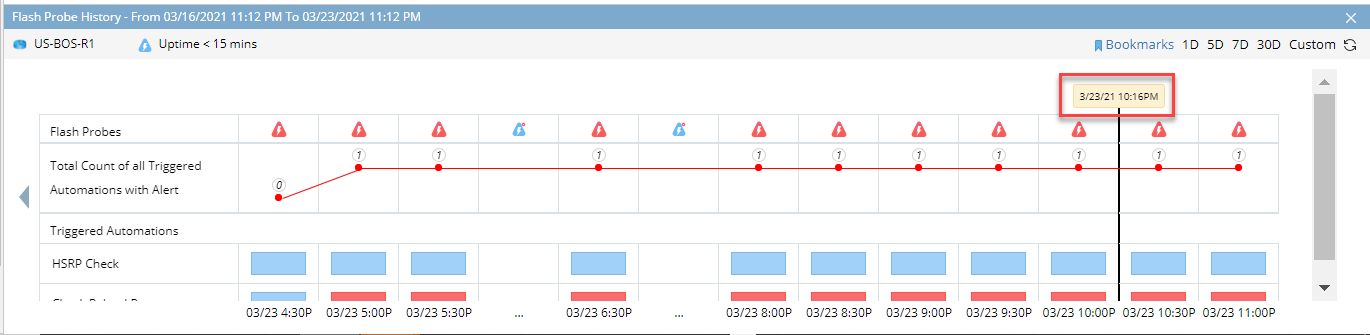
Map time will be visualized in different manners in different scenarios:
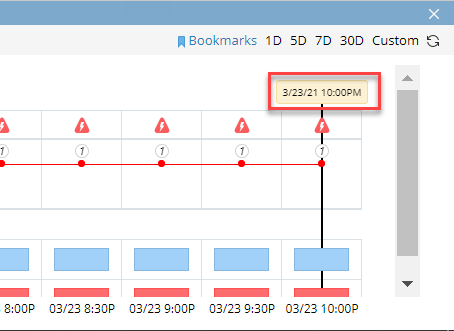
•If the map time equals to an execution time, the line will be placed in the center of the execution time point.
•If the map time doesn’t equal to any execution time, the line will be placed between the 2 closest time points.
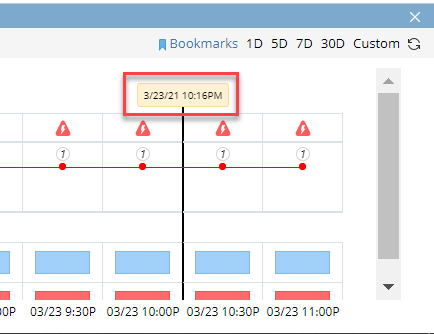
•If the map time equals to an execution time that belongs to a grouped time point or the map time itself belongs to a grouped time point, it will be placed in the center of this group.
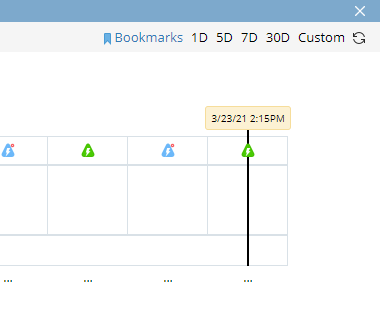
String Variable
The map time is displayed in the time column.
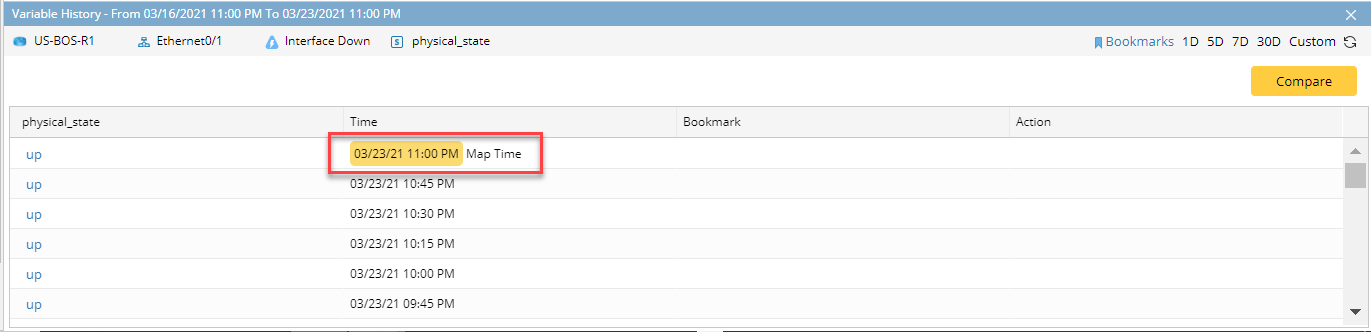
Note: If the map time doesn’t match any execution time, it will be displayed in an empty row between the 2 closest time points.

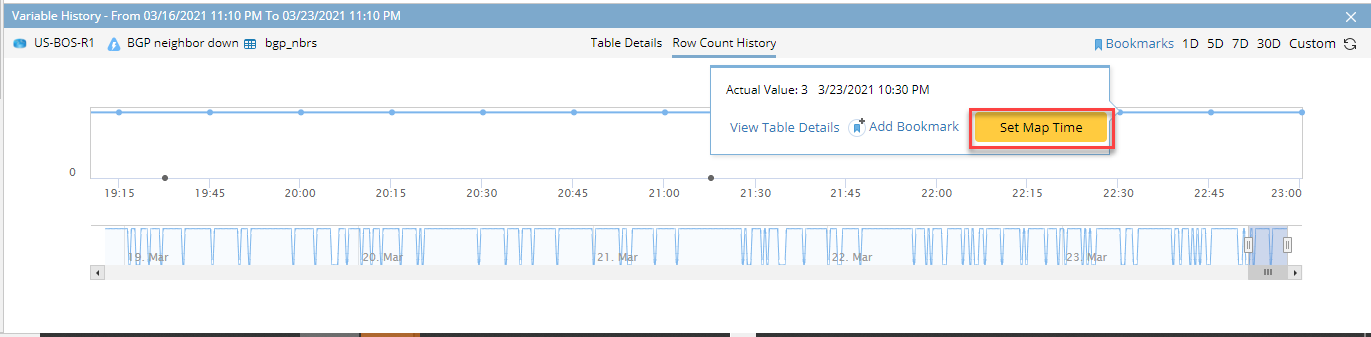
Table Variable
The map time is visualized as a black vertical line in Row Count History tab.
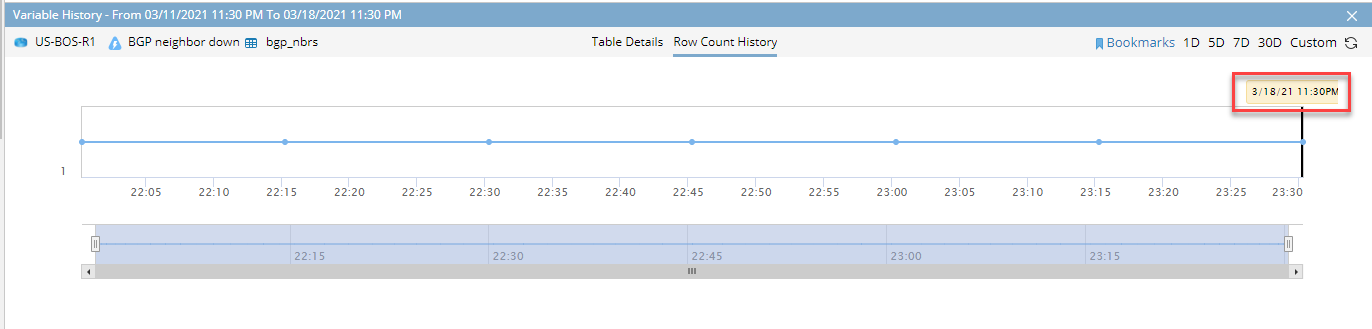
Note: If the map time doesn’t match any execution time, it will be placed between the 2 closest time points.
Number Variable
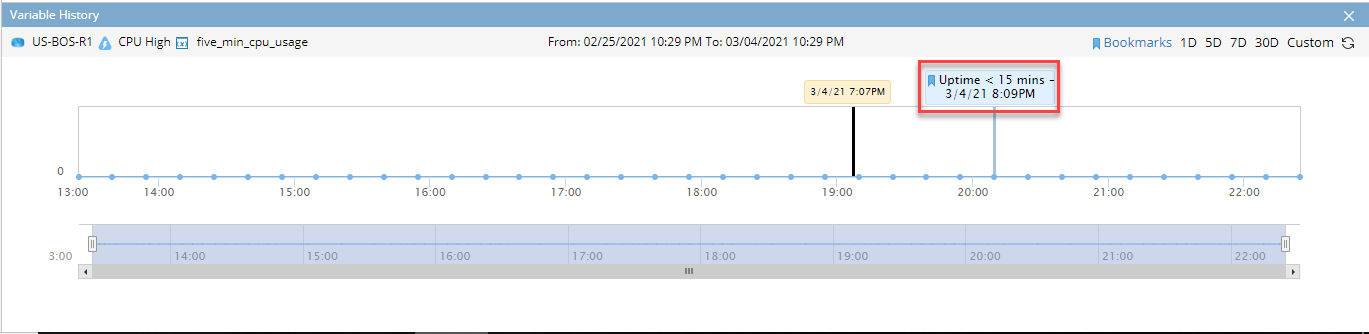
The map time is visualized as a black vertical line in Trend Chart.
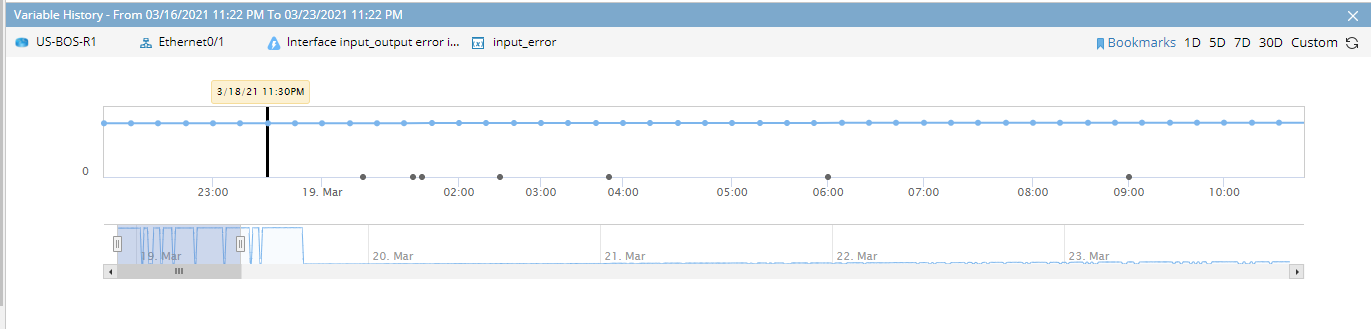
Note: If the map time doesn’t match any execution time, it will be displayed between the 2 closest time points.
Bookmark in Trend Chart
The Bookmark function can be used to mark an interested time point in the Trend Chart. Bookmark can be defined for both Flash Probe and Monitoring Variable.
Flash Probe
Add Bookmark button will be become available when clicking an interested execution time.
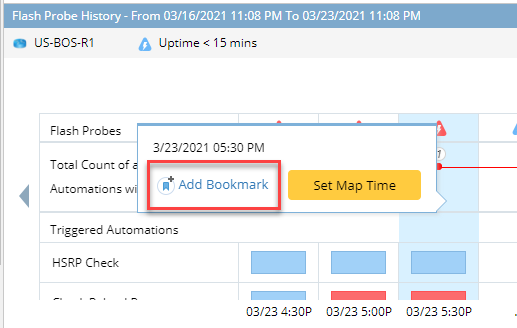
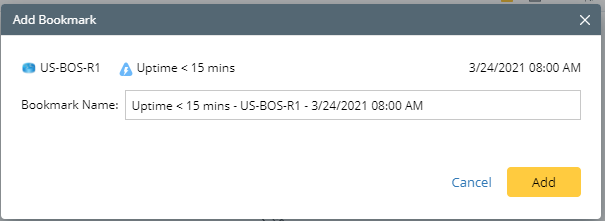
Click Add Bookmark to define bookmark name.
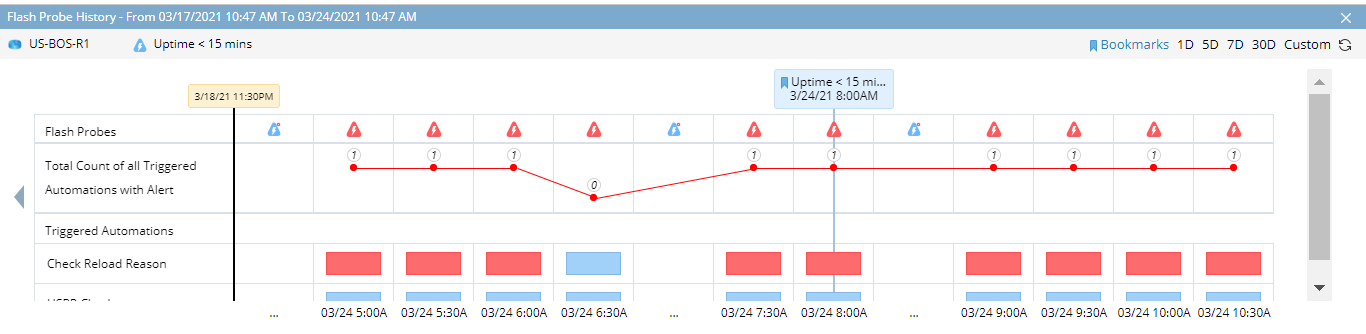
After a Bookmark is added, it will be displayed in Trend Chart as a blue vertical line highlighted with the Bookmark name.
String Variable
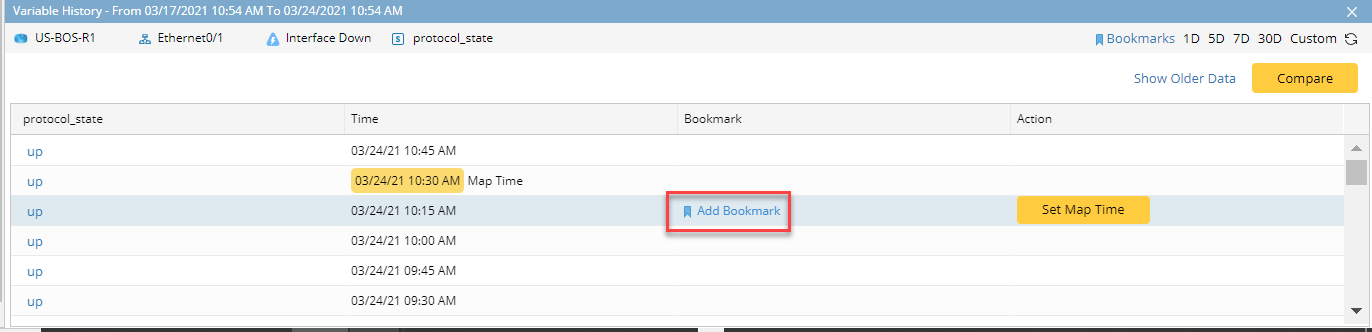
Add Bookmark will become available when hovering on an interested point.
The added Bookmark will be displayed in the Bookmark column.
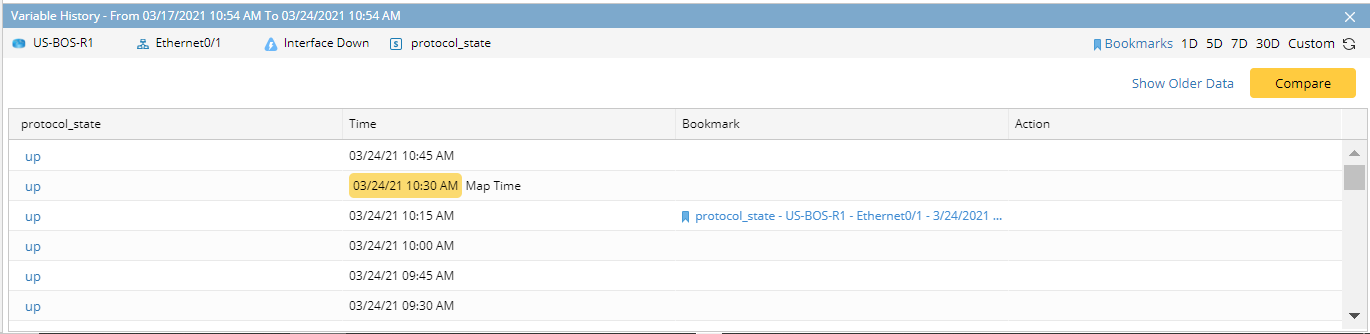
Table Variable
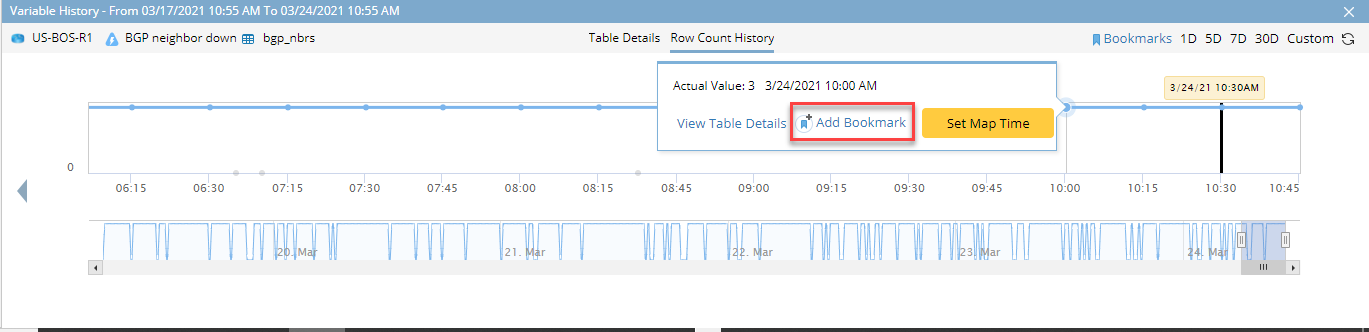
Add Bookmark will become available when clicking an interested execution time.
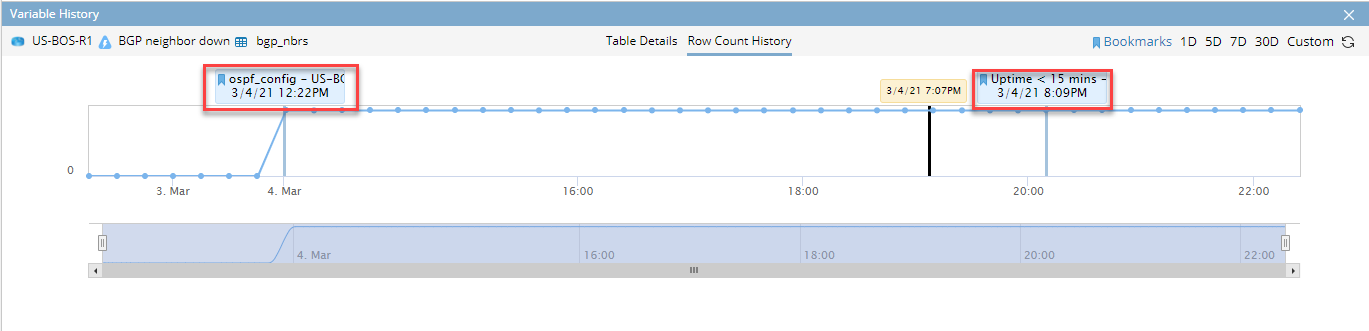
The added Bookmark will be displayed as a blue vertical line with the Bookmark name.
Number Variable
Add Bookmark button will become available when clicking an interested execution time.
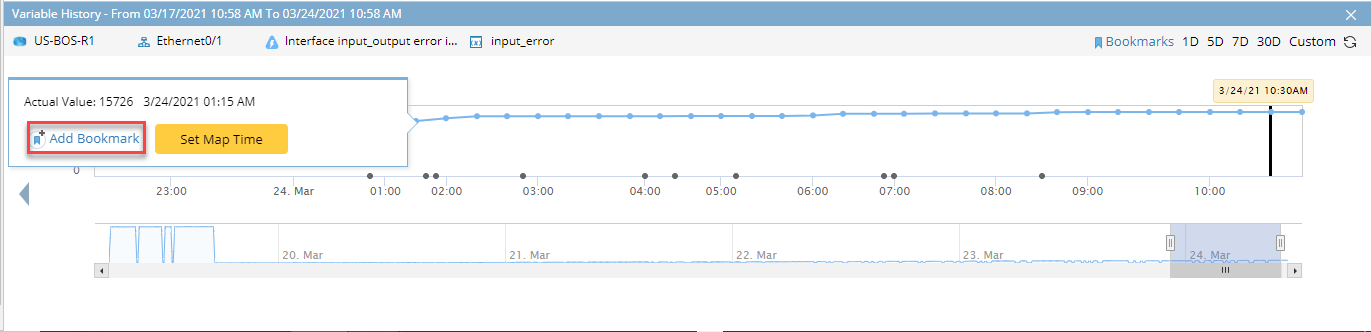
The added Bookmark will be visualized as a blue vertical line with the Bookmark name.
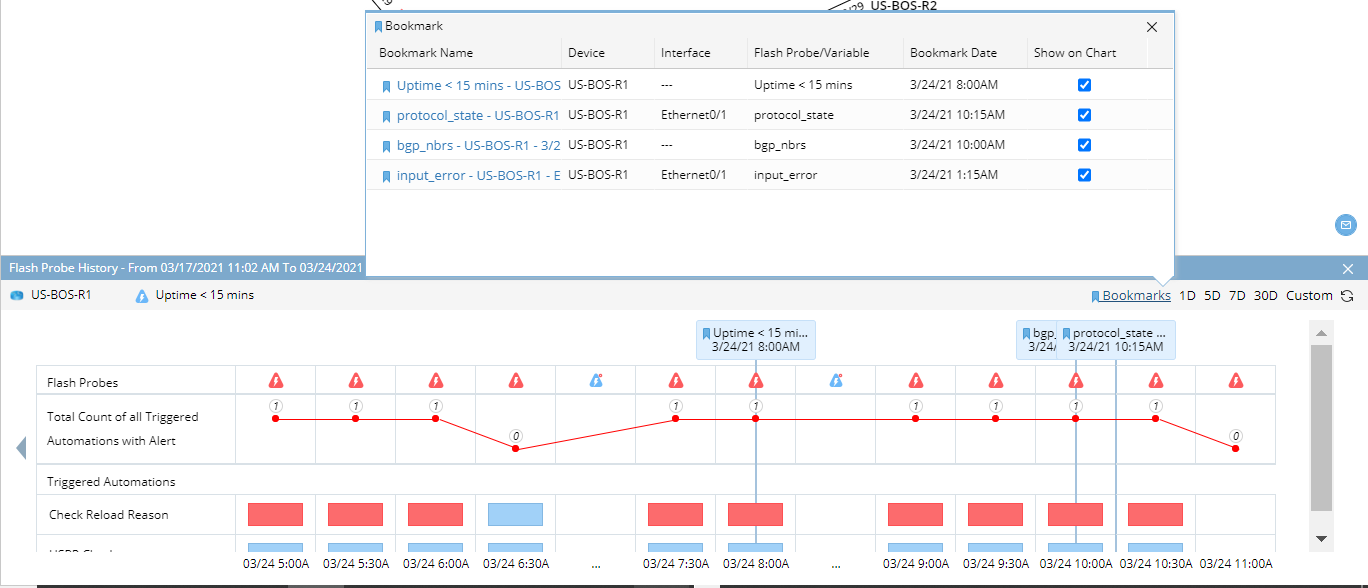
By default, all the newly added Bookmarks will be visualized in each Flash Probe and Monitoring Variable chart for a specific map. Therefore, your team members can quickly identify the symptoms occurred at a specific time point.
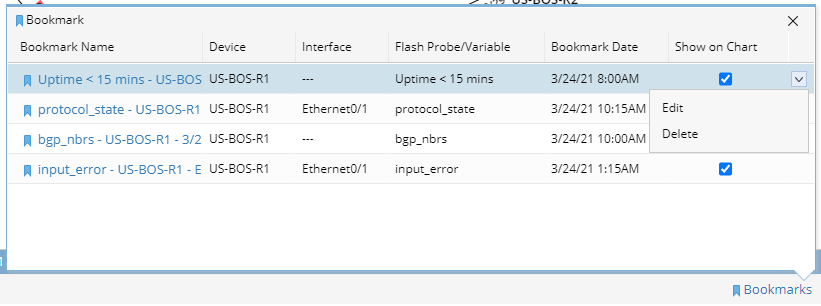
Tip: You can hide some of the Bookmarks by unselecting them in the Bookmark Manager of the current map.
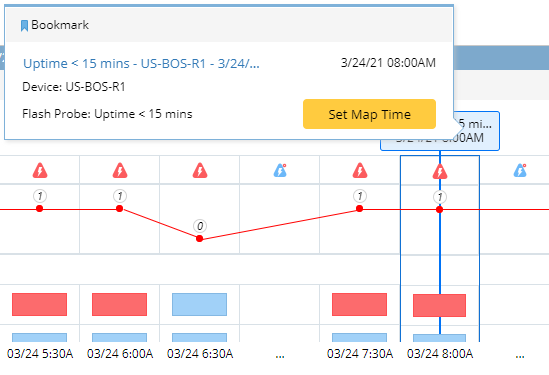
Tip: Each Bookmark can be used to define the map time. Set Map Time button will become available when selecting a specific Bookmark.
Tip: The added bookmark can be edited and deleted in Bookmark manager. The Bookmarks are saved in each map, therefore anyone who opens the map can manage these Bookmarks.
See also:
Using Trend Chart to View Historical Data
Viewing Customized Data Unit in Monitoring Data View