Viewing Flash Probe and Monitoring Variable in Monitoring Data View Pane

Contents
Device Alert Flash Probe
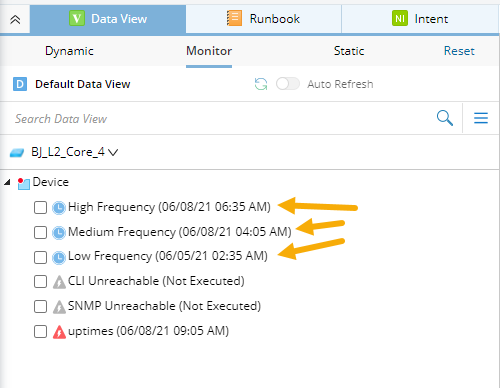
All the enabled device alert Flash Probes are placed under the Device folder.

The Flash Probe will present the latest detection results with different color codes:
Icon |
Meaning |
|
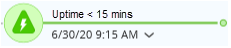
A flash alert has been generated. |
|
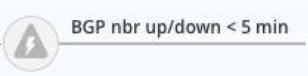
No flash alert has been generated. |
|
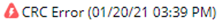
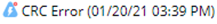
The results are unknown, either the probe was not executed or there’s some error happened during execution. |

Interface Alert Flash Probe
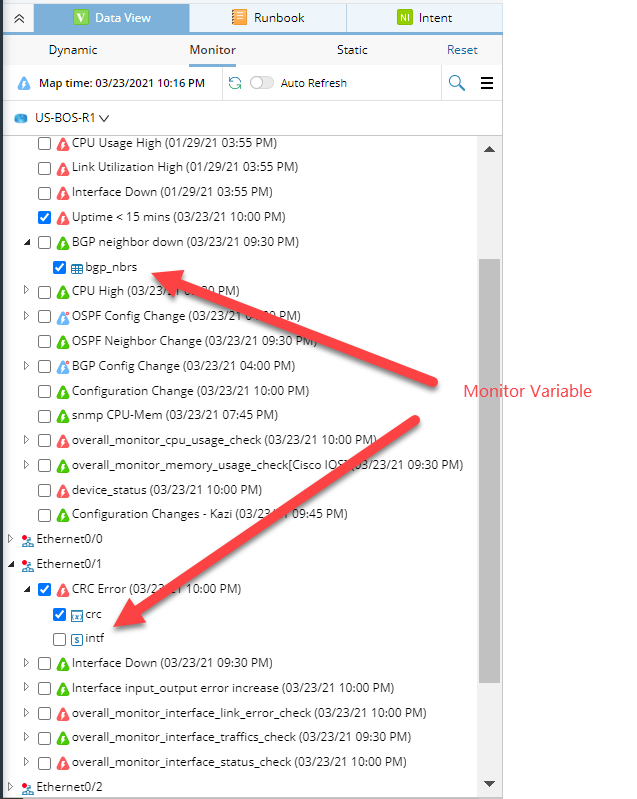
All the enabled interface alert Flash Probes are placed under the respective interfaces defined within this Flash Probe.

The Flash Probe will present the latest detection results for each interface with different color codes:
Icon |
Meaning |
|
The alerts are generated by the Flash Probe. |
|
The alerts are not generated by the Flash Probe. |
|
The Flash Probe has encountered execution error. |
|
The Flash Probe has not been executed yet. |

Timer Flash Probe
All the enabled timer Flash Probes are placed under the Device folder:
Monitoring Variable
The Monitoring Variables are organized and placed under the associated Flash Probes. If the same variable is associated with multiple Flash Probes, this variable will appear under each Flash Probe. If the Monitoring Variable is defined within the
interface alert Flash Probe, it will appear under each interface and the associated Flash Probe.
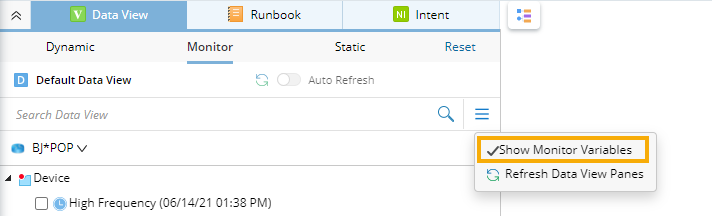
Selecting Show Monitor Variables option so all the Monitoring Variables will be displayed in Monitor Data View Pane.
See also:
Viewing Customized Data Unit in Monitoring Data View
Changing Map Time for Monitoring Data View
Refreshing Monitoring Data View
Switching Monitoring Data between Dynamic and Static Data View
Searching Monitoring Data View Pane