Using Decision Tree to Troubleshoot

Contents
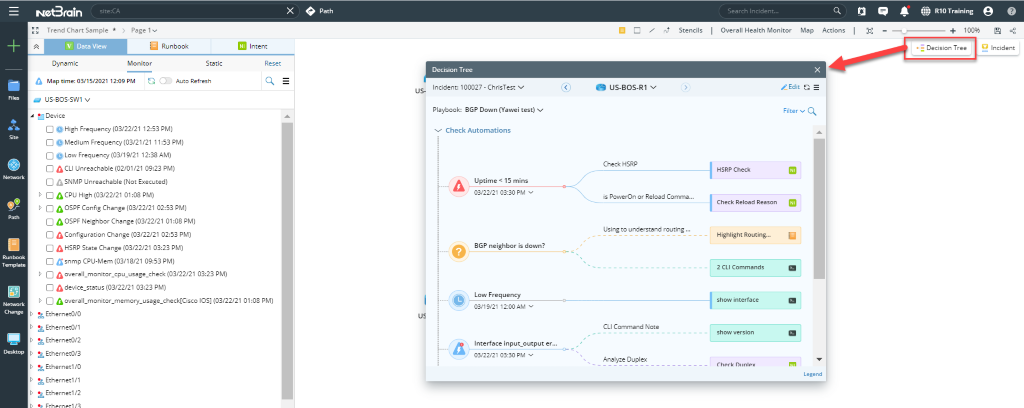
When performing a troubleshooting task, you can open Decision Tree and select the respective playbook to check the network symptoms and automations. Leveraging Decision Tree, you can easily share the key findings with other team members thus tremendously speed up the troubleshooting process.
When the incident pane is activated, the Decision Tree will be automatically associated with the active incident. You can also manually associate the Decision Tree with any interested incident.
The steps below outlines the procedures to leverage other engineer’s knowledge and identify the root cause with the assistance of Decision Tree:
1. Navigating to Decision Tree
4. Viewing Flash Probe Results
5. Viewing Triggered Automation Results
6. Viewing and Executing Recommended Automation
Navigating to Decision Tree
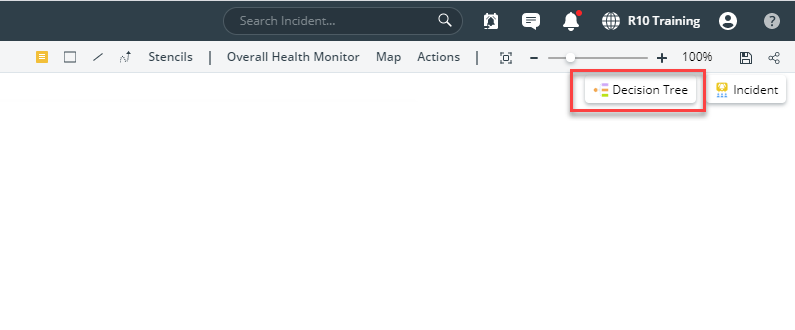
Open the desired map, click Decision Tree.
Selecting One Device
In the Decision Tree window, there are two ways to select a device:
•Select from the drop-down list.

•Using or
or  to switch devices.
![]()
Note: Decision Tree can only display relevant data for one device at a time. As a result, you must select a specific map device or incident device to view the relevant data.
Selecting One Playbook
Click  and select the desired playbook from the playbook section window.

Tip: You can also view the relationship count for each playbook in the window.
Note: In Decision Tree, all the existing relationships belong to a playbook, therefore, a playbook must be specified first in order to check the related relationships.
Note: The Default playbook is a non-editable playbook generated by system. It is associated with all devices.