Viewing Triggered Automation Results

Contents
In Decision Tree, each Flash Probe connects to multiple Triggered Automation assets via solid lines. It essentially means the respective automation assets will be triggered when the associated Flash Probe generates the respective flash alert.
Different color codes are used to differentiate various types of execution results :
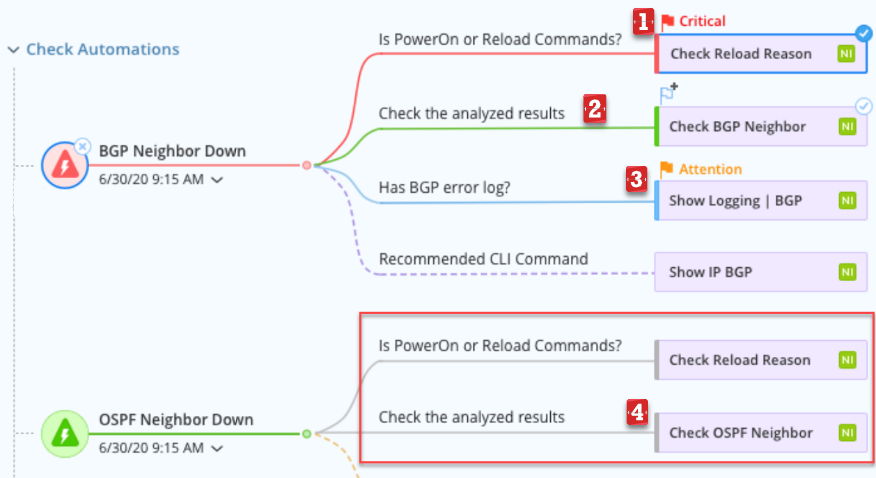
# |
UI Description |
Meaning |
|
Rectangle with red left border/ red connecting line |
The error status code is generated by the Network Intent. |
|
Rectangle with green left border/ green connecting line |
The Network Intent didn't generate the error status code and generated a success status code. |
|
Rectangle with blue left border/ blue connecting line |
No status code has been generated by the Network Intent. |
|
Rectangle with grey left border/ grey connecting line |
The Network Intent has not been executed. |


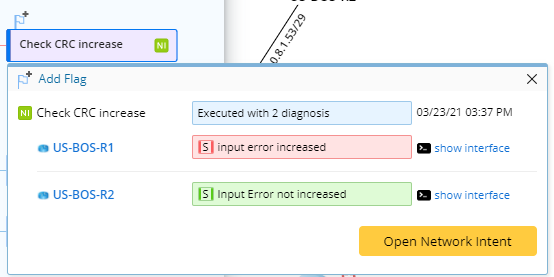
You can click a specific triggered automation to view its detailed information including:
•The name and associated device of the Network Intent
•The status code of the Network Intent
•The device status code
•The execution time of Network Intent
View and Compare CLI Outputs
Follow the steps below to view the original CLI commands/config file and then compare the outputs with the historical data to facilitate root cause analysis.
1.Click the desired triggered automation.
2.Click Config & CLI or Configuration.
3.If clicking Config & CLI , select the desired CLI or Config file from the drop-down.
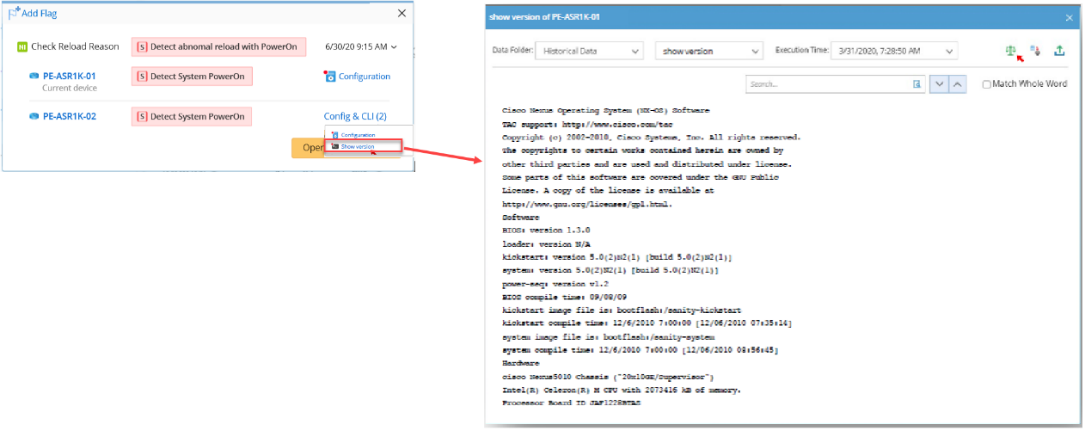
Note: The config file& CLI are collected during the execution of the Network Intent.
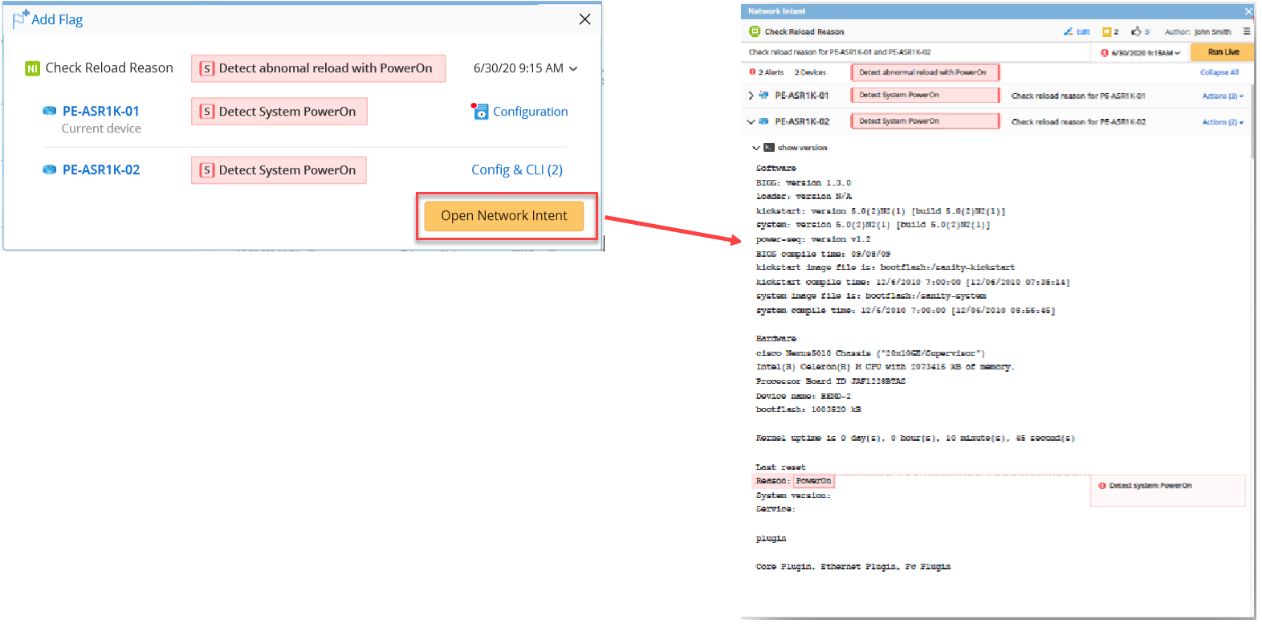
View Network Intent Details
You can click Open Network Intent to pull up the Network Intent detail pane.
Tip: By default, Decision Tree will demonstrate the latest results of Flash Probe and related triggered automation. Alternatively, you can also select a historical time point to view the historical results of a Flash Probe and the related triggered automation.