Viewing Flash Probe Results

Contents
There are three types of Flash Probes:
Device Alert Flash Probe
The icons of Device Alert Flash Probe use different color codes to indicate various types of results:
Scenario |
Flash Probe Icon |
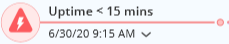
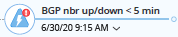
A flash alert has been generated. |
|
No flash alert has been generated. |
|
No flash probe has been executed. |
|
The flash probe executed with error(s). |
|


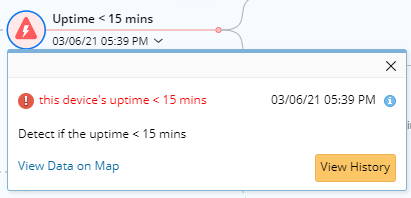
You can click the Flash Probe icon to view its detailed information:
UI Elements |
Meaning |
|
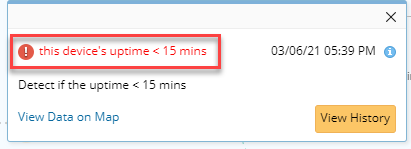
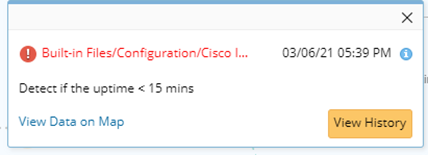
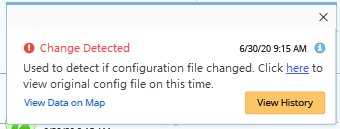
The execution results: A: If the Flash Alert has been generated, the alert message will be displayed. B: If no Flash Alert has been generated, ‘No alert found’ will be displayed. C: If the Flash Probe has been executed but encountered an error, a detailed error message will be displayed. |
|
The execution time of the Flash Probe |
|
The description of the Flash Probe |
|
Pulling up the Flash Probe definition window |
|
Activating Monitoring Data view |
|
Activating Trend Chart |


Tip: For the “configuration change” Flash Probe, clicking hyperlink 'here' will pull up the raw config file if it generates alert.
Interface Alert Flash Probe
The icons of Interface Alert Flash Probe use different color codes to indicate various types of results, which are identical to Device Alert Flash Probe. See: Icons of Device Alert Flash Probe
You can click the Flash Probe icon to view its detailed information:
Scenario |
Sample UI |
Notes |
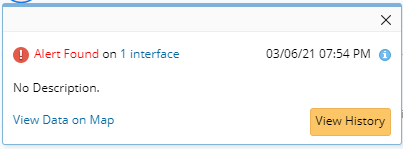
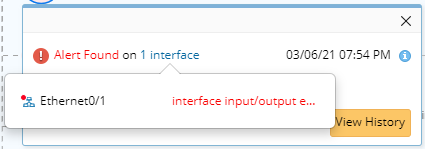
A flash alert is generated by interfaces. |
|
• The message ‘Alert found on [n] interfaces’ will be displayed. [n] refers to the number of interfaces that generate the flash alert. •Detailed alert messages of each interface will be displayed when clicking [n] interfaces. |
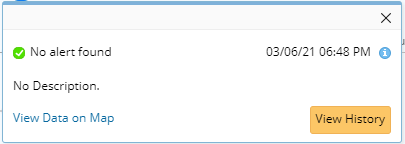
No interface has generated any flash alerts. |
|
‘No alert found’ will be displayed. |
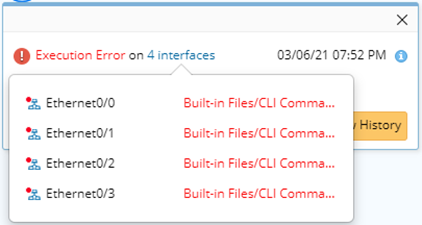
No flash alert has been generated by any interface due to interface execution error(s) |
|
•The message ‘Execution error on [n] interface’ will be displayed. [n] refers to the number of interfaces with execution error(s). •Detailed alert messages of each interface will be displayed when clicking [n] interfaces. |
Timer Flash Probe
The Timer Flash Probe has only one status, therefore it has only one color.
You can click the Timer Flash Probe to view its detailed information:
![]()
UI Elements |
Meaning |
|
The description of the Timer Flash Probe |
|
The execution time |
|
Pulling up the Flash Probe definition window |
|
Activating Monitoring Data view |
|
Activating Trend Chart |