Using Trend Chart to View Historical Data

Contents
When you select a Flash Probe or Monitoring Variable in the map, the respective Trend Chart will prompt presenting the historical data of the selected Flash Probe or Monitoring Variable:
▪Monitoring Variable Trend Chart
Flash Probe Trend Chart
The Trend Chart can present the historical results of Flash Probe with respective triggered automation results.

The trend chart can help you better understand the following scenarios with its rich clickable functions:
▪The Flash Probe generates flash alert(s)
▪The Flash Probe does not generate any flash alert
▪The Flash Probe has execution errors
The Flash Probe generates flash alert(s)
If the Flash Probe generates a flash alert, this alert will be displayed as an alert icon in Trend Chart with a specified time point. For example, the Flash Probe generated flash alert at 2:39 PM 03/04 in the following chart.

Clicking the alert icon will pull up a summary view presenting the alert message, execution time and Flash Probe descriptions.

If the Network Intents are defined to trigger execution by this Flash Probe when it generates the flash alert, the results will also be displayed in Trend Chart.
•If the Network Intent generates error status code, the Total Count of all Triggered Automation with Alert will accumulate.

Note: One Network Intent will only be counted once even it generated multiple error status codes.
The error status code of Network Intent will appear after you click the count number.
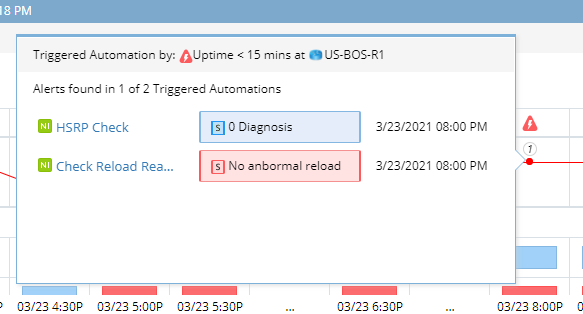
•There are three possible results for each Network Intent:
º Generated error status code
º Generated success status code
º Executed but no status code generated

Clicking any result will pull up a summary view presenting the status codes and the original CLI commands. Clicking Open Network Intent button will pull up the NI detail pane.

The Flash Probe does not generate any flash alert
If the Flash Probe does not generate any flash alert, the no-alert icon will appear in Trend Chart. If the Flash Probe has been continually executed for multiple times and none of them generates flash probe, these results will be grouped together.

Clicking no-alert icon will pull up a summary view presenting the execution time of the Flash Probe.

If the number of grouped time points exceeds 5, only the oldest time point and 4 most recent time points will be displayed.

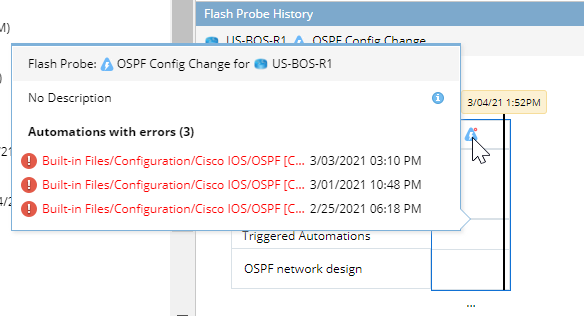
The Flash Probe has execution errors
If the Flash Probe has execution error, the error icon will appear in Trend Chart. If the Flash Probe has been continually executed for multiple times with error results, these results will be grouped together.
![]()
Clicking no-alert icon will pull up a summary view presenting the error code and execution time. If the number of grouped time points exceeds 5, only the oldest time point and 4 most recent time points will be displayed.
Monitoring Variable Trend Chart
Trend Chart can also present the historical values of monitoring variables. Similar to Dynamic Data View, trend chart supports 3 types of variables:
String Variable
The string type variable displays in the table format to show variable value at each execution time point.

The compare function is to compare the variable values between 2 execution time points.

Table Variable
The table type variable has 2 tabs:
oRow Count History tab demonstrates the table row count at each execution time point in the form of chart diagram.

oTable Details tab demonstrates the table data for a specified execution time.
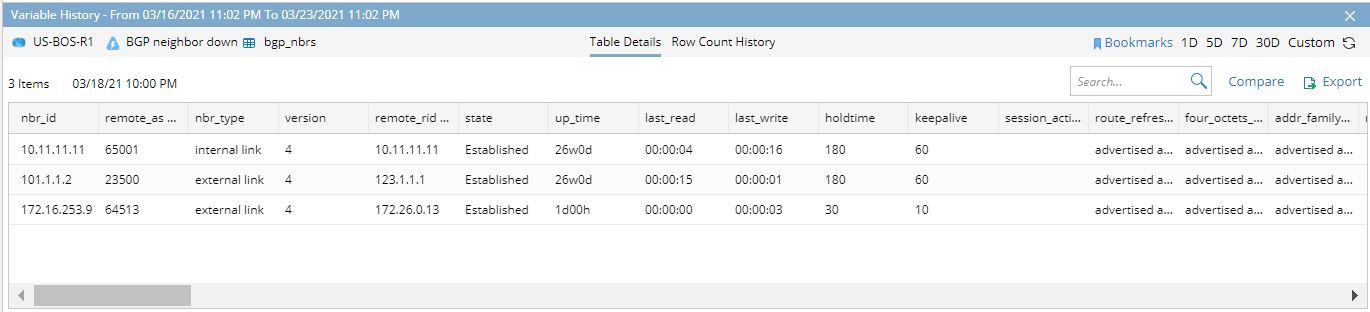
Tip: The compare function can be used to compare the data between 2 execution time points.
Tip: The export function can be used to export this table as CSV format.
Number Variable
The INT, double and string type variables are displayed in the chart form to demonstrate the monitoring value at each execution time point.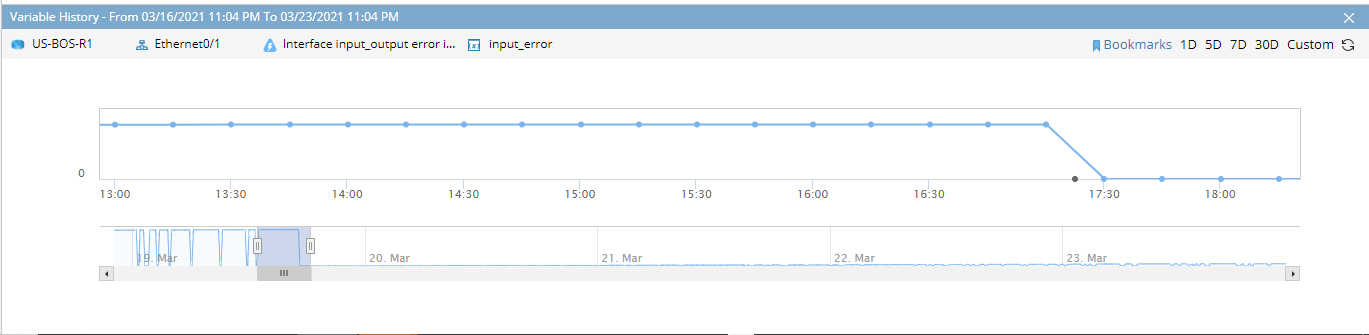
See also:
Using Trend Chart to Change Map Time for Monitoring Data View
Adjusting Data Scope