Data View Category

Contents
Data views can be categorized into the following types:
▪Dynamic Data View ( or
or ![]() )
)
▪Static Data View (![]() )
)
▪Map Data View (![]() )
)
Dynamic Data View
Dynamic Data View refers to those data views generated by applying Data View Templates (DVT) to a map page. See Applying a Dynamic Data View to View Alert and Drill Down for more details.

Tip: The ![]() indicates the data view template has been scheduled to run; the icon indicates the data view template hasn't been scheduled to run.
indicates the data view template has been scheduled to run; the icon indicates the data view template hasn't been scheduled to run.
Tip: To pull live data in a data view, you can toggle the switch from Cache to Live.
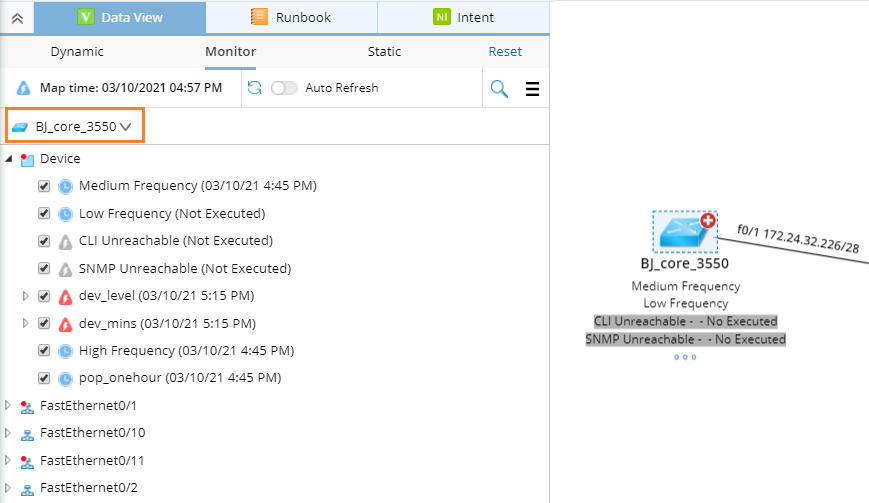
Monitor Data View
Monitor Data View refers to data views generated by applying the flash probes and variables enabled by the devices on the current map. You can get the latest flash probe and variable results by clicking the  icon.
icon.
Static Data View
Static Data View (SDV) is a snapshot that contains the device data at a particular moment.
SDVs can be generated by using the following ways:
▪Run the scheduled Qapps or Gapps. You can browse these SDVs in the folder Scheduler.
▪Apply a DVT and save it as an SDV.
▪Edit an existing SDV or Map Data View, and save it as an SDV.
Map Data View
Map Data View refers to a data view that is saved within a map, and can only be visible in the current map. It is generated by saving a dynamic/static data view.
To view Map Data Vies, navigate to the Static pane.
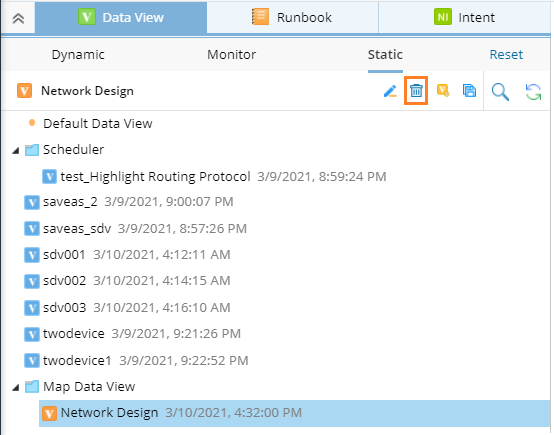
Tip: You can click the above pencil icon to edit the map data view after the data view is applied.
Default Data View
By default, devices on each map page are displayed in the default data view.

Tip: To update a default data view with the latest data saved in the database, you can configure through a scheduled benchmark task. See Updating Default Data View for more details.
Default Data Units on Traditional Device Positions
Position |
Device Data Unit |
|---|---|
Position1 |
Management IP |
Position2 |
Device Type |
Position3 |
NULL |
Position4 |
NULL |
See the picture below to understand the device position.
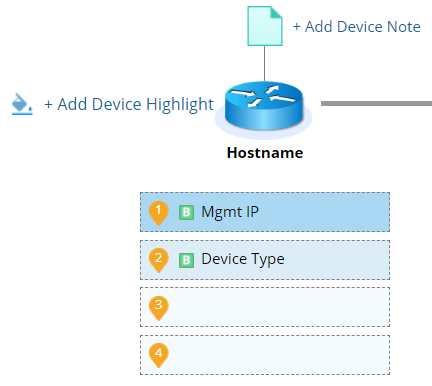
Note: If the value of a data unit is null, it will not be displayed in the specified position.
Default Data Units on Traditional Interface Positions
The following table lists the default data units on each interface position for different topology types.
Position |
IPv4 L3 Topology |
IPv6 L3 Topology |
L2 Topology |
IPSec VPN Topology |
GRE VPN Topology |
|---|---|---|---|---|---|
Position1 |
Routing Protocol |
Link-local Address |
Mode |
Crypto Endpoint |
IP Address |
Position2 |
NULL |
IPv6 Routing Protocol |
Trunk Encapsulation |
Ident Traffic |
Source |
Position3 |
Multicasting Mode |
Multicasting Mode |
Speed |
Crypto Map |
Destination |
Position4 |
MPLS VRF |
MPLS VRF |
Duplex |
NULL |
NULL |
Position5 |
Inbound ACL |
Inbound ACL |
Access VLAN |
NULL |
NULL |
Position6 |
Outbound ACL |
Outbound ACL |
Native VLAN |
NULL |
NULL |
Position7 |
Description |
Description |
Description |
NULL |
NULL |
Position8 |
NULL |
NULL |
NULL |
NULL |
NULL |
Default Data Units on SDN Device Positions
The following table lists the default data units on each position for SDN devices.
Position |
ACI |
VCenter |
NSX |
||||||
|---|---|---|---|---|---|---|---|---|---|
Fabric Node |
VRF |
Subnet |
End Point |
L3 Out |
Cluster Compute Resource vSwitch |
VMware Distributed Virtual Switch |
Computer Resource VSwitch |
NSX Logical Switch |
|
Position1 |
oobMgmtAddr |
NULL |
Ip Address |
Ip Address |
Ip Address |
NULL |
NULL |
NULL |
NULL |
Default Data Units on SDN Interface Positions
The following table lists the default data units on each interface position for SDN devices.
Position |
ACI |
VCenter |
NSX |
||||||
|---|---|---|---|---|---|---|---|---|---|
Fabric Node |
VRF |
Subnet |
End Point |
L3 Out |
Cluster Compute Resource vSwitch |
VMware Distributed Virtual Switch |
Computer Resource VSwitch |
NSX Logical Switch |
|
Position1 |
IP Unnumbered |
NULL |
NULL |
NULL |
NULL |
Port Group |
Port Group |
Port Group |
NULL |
Position2 |
NULL |
NULL |
NULL |
NULL |
NULL |
VLAN |
Connectee |
VLAN |
|
Position3 |
NULL |
NULL |
NULL |
NULL |
NULL |
NULL |
VLAN |
|
|
Position4 |
NULL |
NULL |
NULL |
NULL |
NULL |
NULL |
Port Name |
|
|
See also: