Applying a Dynamic Data View to View Alert and Drill Down

Contents
All devices on a map page are displayed in the Default Data View. You can directly apply a predefined data view template on the map to initiate network troubleshooting.
Example: Apply the data view of Overall Health Check to troubleshoot a slow application.
1.On a map page, click Overall Health Check in the Dynamic Data View pane to preview it and then click Apply.

Tip: For more explanations about the number of Golden Baseline Alerts shown in the Data View pane, refer to Golden Baseline Alert Count.
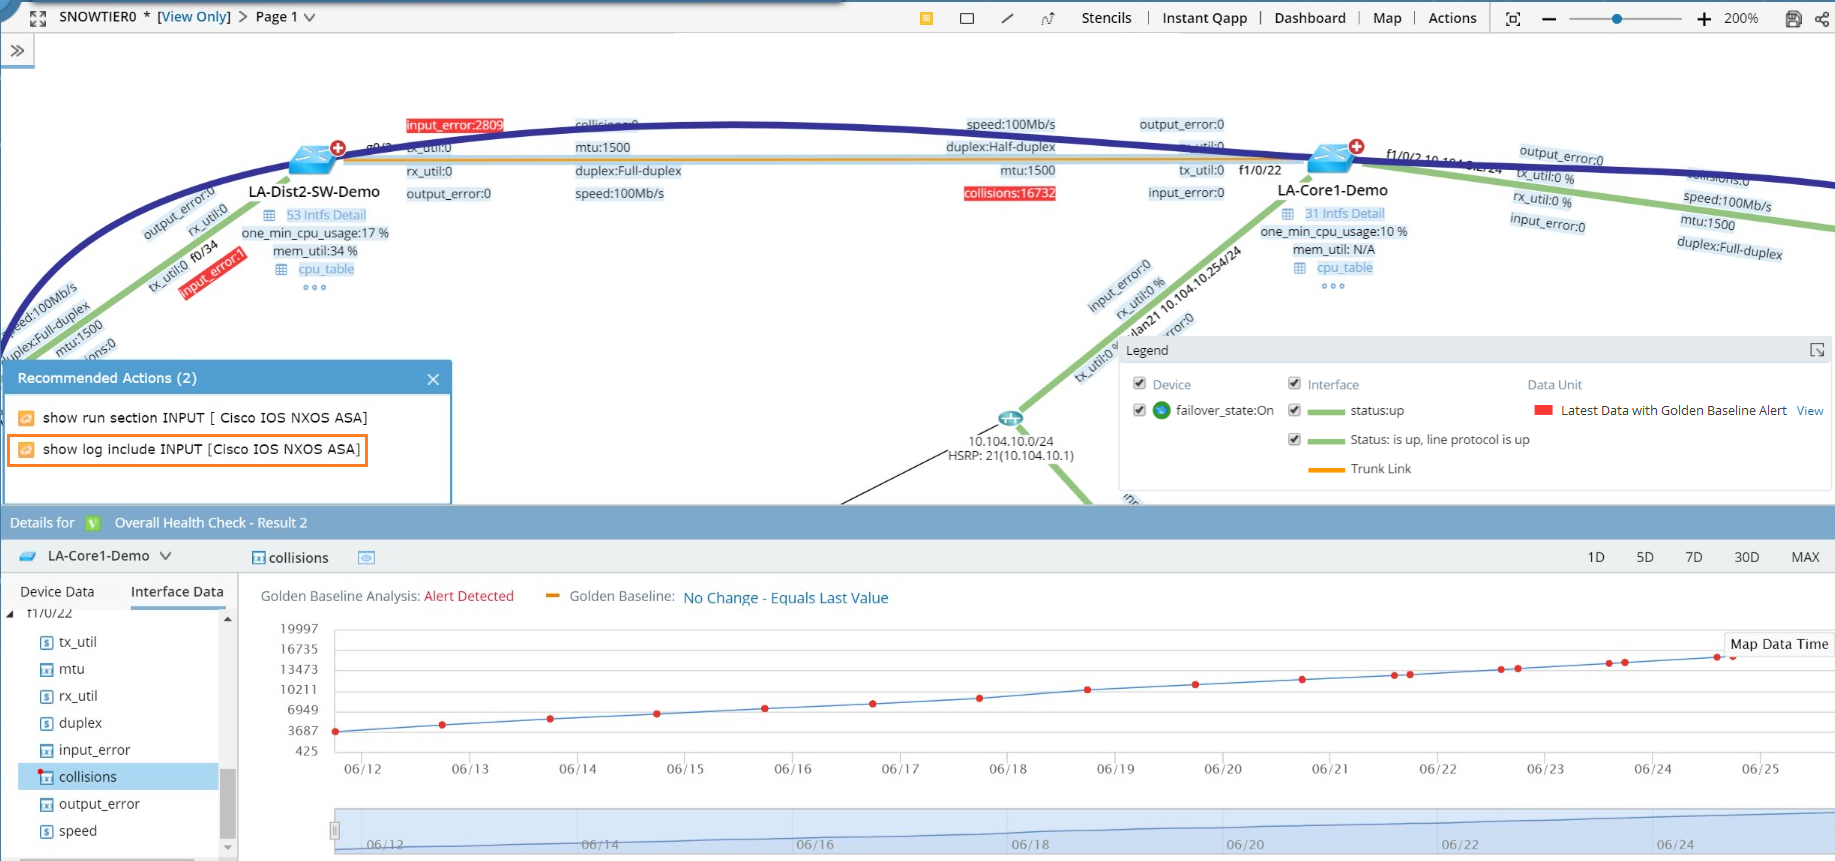
2.Take an overview to understand the network design and operation status, and look into the alerts. Click an alerting metric to view its historical data in the Details pane.

Tip: See Detail Pane for more information about historical data analysis.
3.Click 2 Recommended Actions and select show log include INPUT [Cisco IOS NXOS ASA] to run a Qapp for further analysis.
4.View the running result to address the root cause of the alert. In this case, the alert is caused by a duplex mismatch.

5.Go back to the Details pane and select the duplex variable.
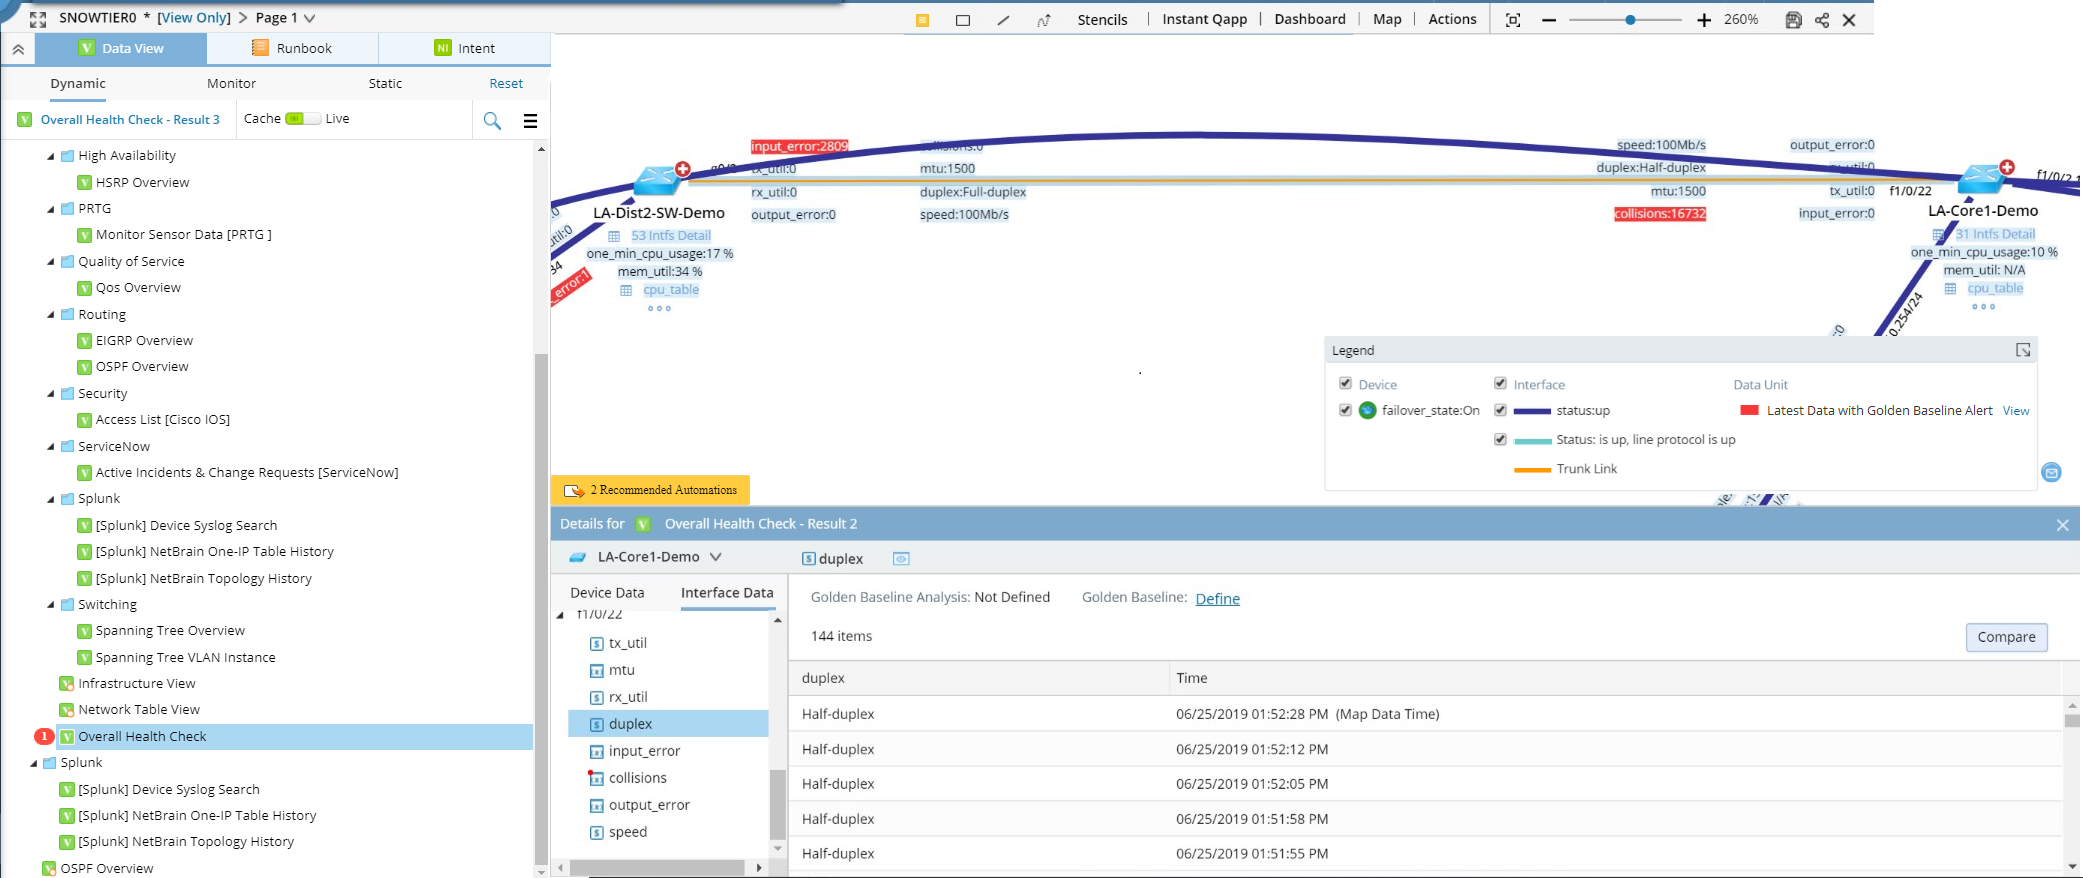
6.Click Define to modify the rule as intfs_table.duplex Equals Full-duplex and re-apply the data view to proactively identify the anomaly.
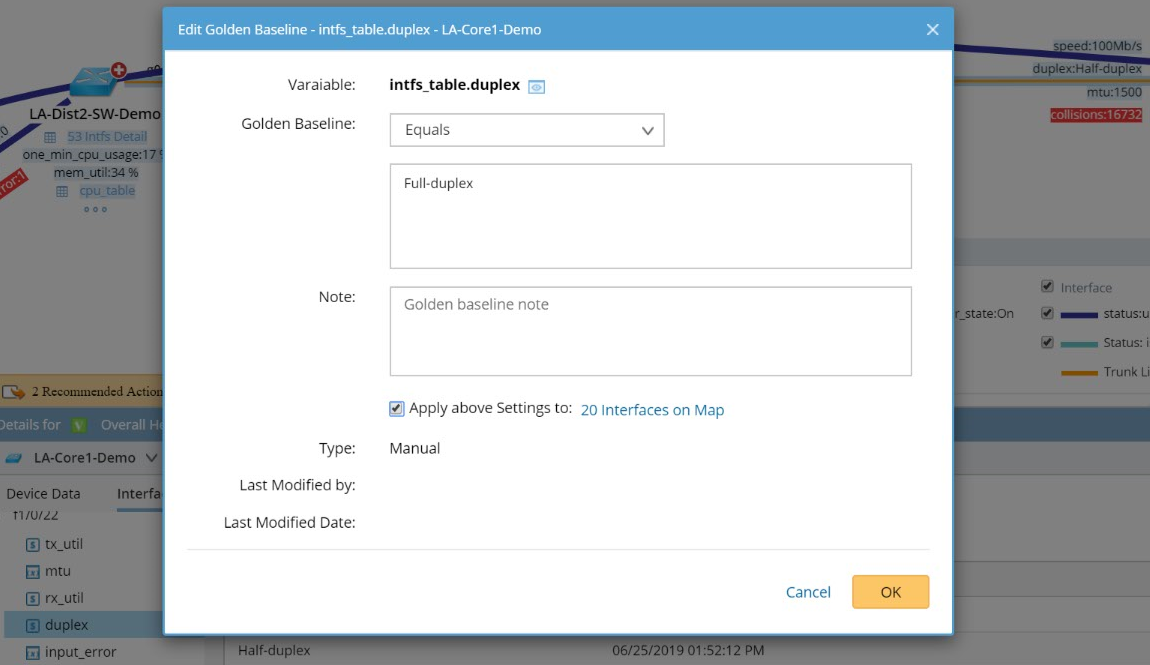
With the enhanced Golden Baseline rule, your colleagues will track the issue easily.

Tip: If filter criteria is defined in the data view template, only the devices that match the criteria can generate data views.
See also:
▪Sharing Golden Baseline Alerts
▪Creating a Data View Template