Viewing Golden Baseline Analysis Result

Contents
The analysis and comparison results between historical data and Golden Baseline can be visualized by Applying a Data View Template to a map. The analysis results between the last copy of historical data and Golden Baseline are displayed on the map, and the Detail Pane offers the analysis results between more historical data and Golden Baseline.
This section introduces the following topics:
▪View Comparison Result with Golden Baseline
▪View Historical Data Analysis in Detail Pane
▪Compare Data with Golden Sample
View Comparison Result with Golden Baseline
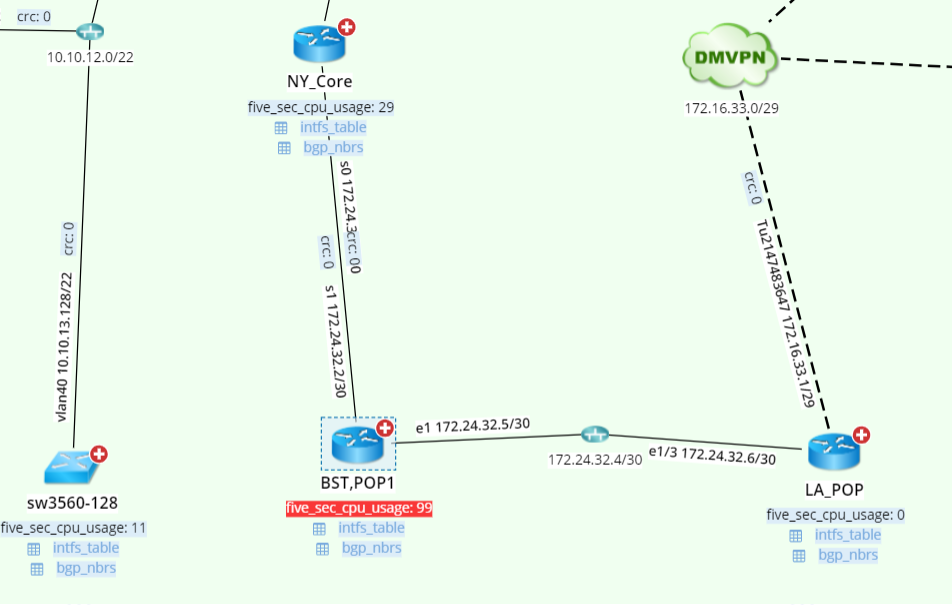
After Applying a Data View Template to a map, you can view not only the last copy of historical data and Golden Baseline, but also the live data analysis. When it doesn't match the Golden Baseline Rule, it will be highlighted in red color to alert users.
View Historical Data Analysis in Detail Pane
The left side of the Detail Pane lists all variables in the current dynamic data view. If the last value of a variable doesn't match Golden Baseline, a red dot will appear over its icon, and its data unit on the map will be in red color. The right side of Detail Pane shows the comparison analysis between a data point and all historical data points. The Golden Baseline Analysis field shows the current analysis result targeting all data. Once there is an alert, “Alert Detected” will be shown. If the Golden Baseline Rule is manually changed, the system will re-analyze all historical data according to the new Golden Baseline to address the off-normal, and refresh historical alert results.
Number-Type Variable:
The values are displayed in a chart, and red dots refer to off-normal items.

String-Type Variable:
The values are displayed in a table, and the off-normal item is highlighted in red.
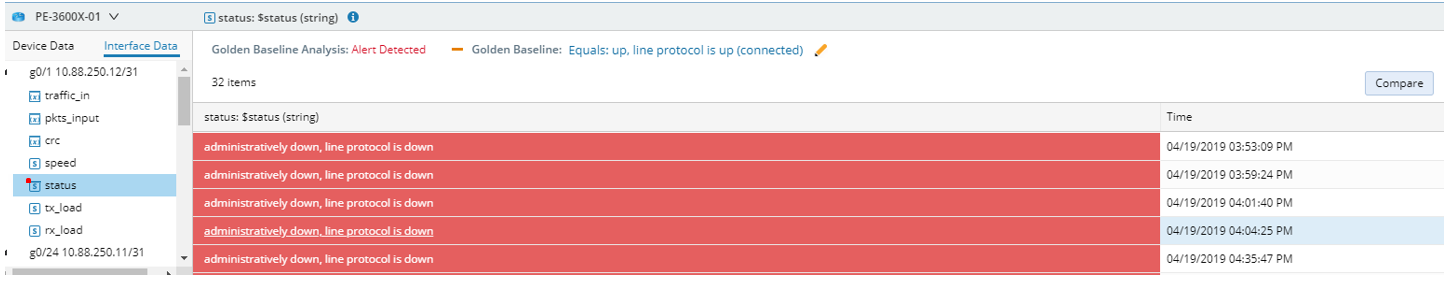
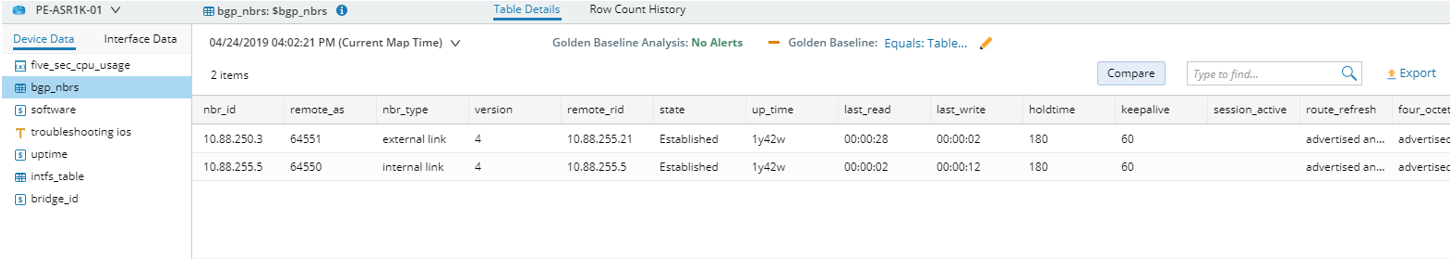
Table-Type Variable:
Only the current values are displayed. If there are any off-normals, alerts will be displayed in the Golden Baseline Analysis field.
Compare Data with Golden Sample
Both string-type and table-type parser variables can be compared to a golden sample, that is, a copy of data that can match the Golden Baseline Rule.

▪For manually defined Golden Baselines, the data will be checked against a Golden Baseline Rule each time, so the golden sample is actually the last data point that matches the Golden Baseline Rule.
▪For auto-calculated Golden Baselines, the data will only be checked against Golden Baseline Rule at the first time when the rule is defined, so the golden sample is the first data point that matches the Golden Baseline Rule. When the Golden Baseline Rule is changed, the golden sample will be refreshed.
Note: For table-type variables, only the table columns selected in the comparison setting of parser definition will be compared. You can also temporarily adjust the desired table columns to view the comparison result.