2023-Nov-03-R11.1a
Create and Manage Network Intent
Network Intent (NI) describes a network design for a specific network device, what these design baselines are like, and how to verify the design works properly. It provides a way to document network design intent, allowing other engineers to understand the device's design and baseline or normal state of a particular device. NI is supported by the Visual Parser on Configurations, SNMP, CLI commands, API in no-code automation flow.
NI is the cornerstone of the Problem Diagnosis Automation System (PDAS) reference workflow. The following diagram illustrates how intent works in PDAS system: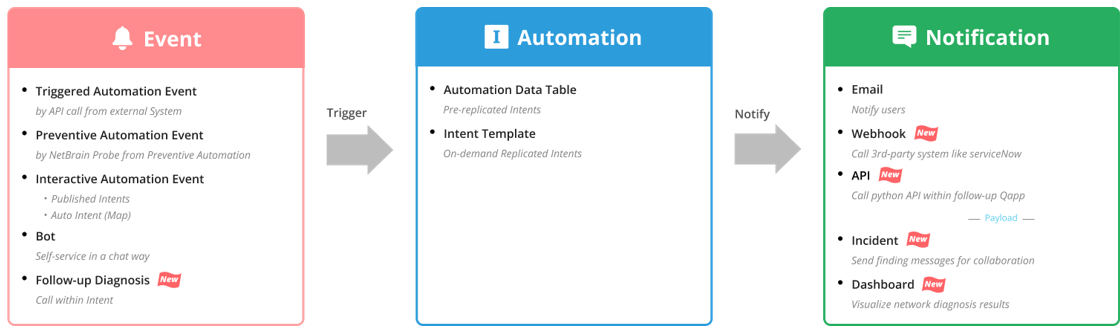
PDAS-NG has updated no-code intent capture, replication, and execution in many ways, including:
- On-Demand replication of Intent
- Major enhancement of Intent’s no-code programmability.
- Use Intent to drive programable notification to 3rd party solution.
- Other enhancements such as supporting intent across API-based network such as SDN or Cloud
Enables intent to address five of most complex use cases for network management:
- Outage Prevention
- Transient Problems Troubleshooting
- Application Performance
- Network Security
- Protective Change
Main UI of NI
The key components of NI are as follows: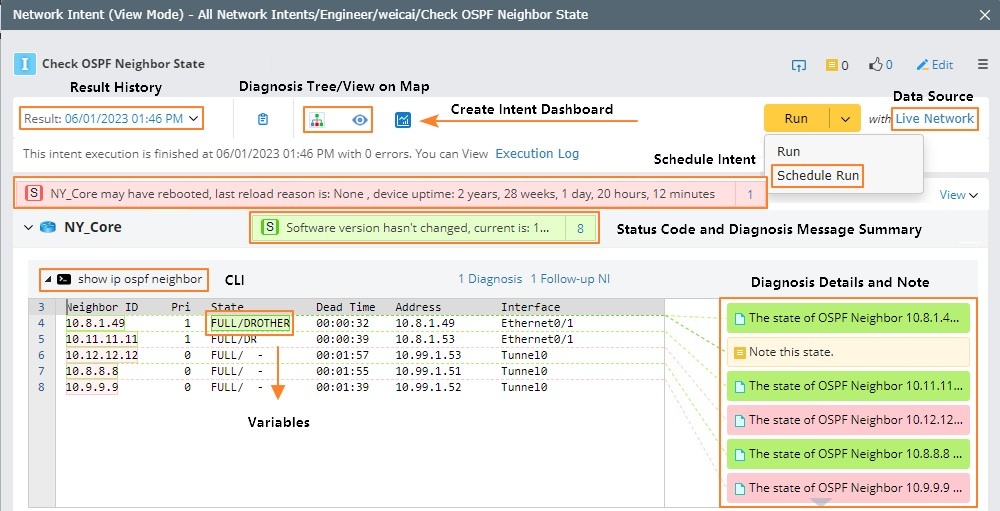
- Result History: display the data size of the NI result and the total size of the current intent.
- View on Map: a map embedded in an intent to show the network relationship between devices of this intent.
- Schedule Intent: schedule an intent directly.
- Data Source: the data source for running an intent.
- Device(s): the network device with which this NI is associated.
- Config, SNMP, and CLI: the device configurations or CLI command outputs for this NI.
- Variables: the variables decoded by the visual Parser of this NI.
- Notes, Diagnosis, Status Codes, and Diagnosis Details:
- Notes: any text describing the design, best practice, and hint.
- Diagnosis and Status Code: executable codes for home intent and its follow-up intents to verify the design and create an alert if it is violated.
- Diagnosis Details and Compare Pane: display the statistics of the diagnosis defined in the current command section and you can directly view the diagnosis output and compare the original text output.