Part III: Problem Diagnosis and Preventive Automation
Network problems are often organized by a Ticket System in the form of incidents. In the real world, 95% of network problems are repetitive. However, these identical or similar problems are diagnosed the same way each time without automation. Further, over 50% of problems are preventable, caused by misconfiguration, performance degradation or security violation. But enterprises lack the automation to enforce the design rules, best practices, or security policies to prevent these problems from happening again effectively.
NetBrain provides an intent-based automation platform (Problem Diagnosis Automation System, PDAS) to address both problems by automating the diagnosis of repetitive problems and the enforcement of preventive measures across the entire network. It can address up to 95% of network service tickets, reduce service times by up to half, and proactively prevent up to 50% of abnormal network conditions that would otherwise lead to the creation of even more service tickets.

The foundation of the NetBrain automation platform is Network Intent (NI), an automation construct that allows users to define expected design and operational state. It establishes a baseline configuration and operational state to validate the network design. Further, users can run NIs to detect design and operational deviations during troubleshooting or set up a scheduled task to run a set of NIs to assess the whole network.
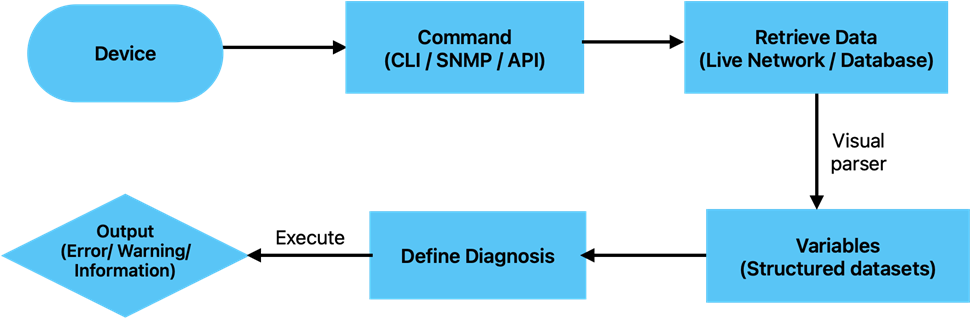
An NI takes a device and a command (CLI/SNMP/API) as input, retrieves data from the live network or database, parses the data into structured datasets (variables), runs the diagnosis on these variables, and outputs the network status (error/warning/info).
The following are some examples of NI:
- Enforce configuration compliance and prevent configuration drift. For example, you can create an NI to check the current configurations against the Golden Config, which can be discovered systematically via the NetBrain Reverse Engineering method.
- Continuously monitor the operational status. For example, you can create NIs to monitor the general health of a network device, such as the reachability, uptime and reboot reason, performance data, and temperature. You can also create NIs to monitor the specific vendor functions, such as the virtual server and pool member of an F5 load balancer.
- Check the failover. Create an intent to check whether the failover status changes and monitor the performance if a failover occurs.
The NetBrain system provides a Golden Engineering Studio (GES) for you to systematically discover the Golden Config and Golden Features of your network and build Golden Intents to prevent the drift from these Golden Configs and verify the design of Golden Features.

Depending on the network status detected by an intent, an intent can be programmed to perform actions to call other NetBrain functions and even integrate with a third-party system, for example,
- Integrate with the NetBrain Change Management (CM) module by defining a network change to auto-remediate the drift from the Golden Config or an abnormal network state.
- Close a ServiceNow ticket via Webhook if the intent polls the live network and observes that the symptom of the ticket no longer exists.
- Call another NI or itself as a follow-up to form a diagnosis flow. For example, users can add Check duplicate router ID and Check EIGRP neighbors as the follow-up NI if the EIGRP routes change.
- Create a CSV report to document the network state.
- Create a map and show the network state data on the map (DataView).
An intent (seed NI) can be replicated for all qualified devices through the whole network or as a set of network devices via an Intent Replication Wizard. An Intent Template (NIT) will be defined for this purpose, including the definition of the target devices, rules to replace the Macro Variables, etc. The cloned intents can be grouped into a column of an Automation Data Table (ADT), which is the other key component (besides the intent itself) for intent-based automation.
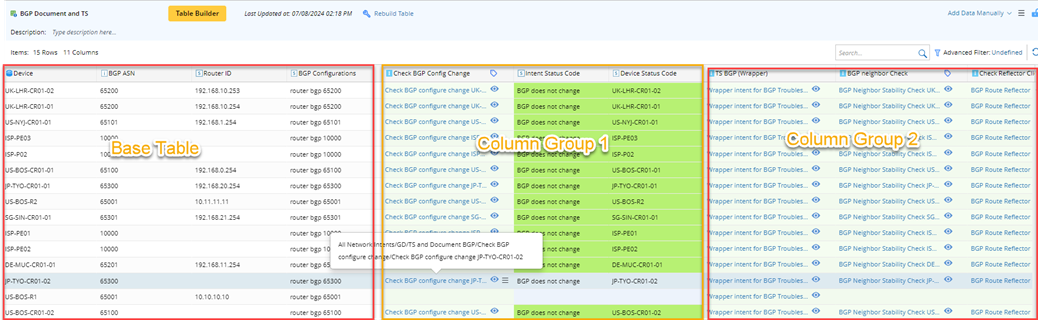
An ADT contains a base table, which can be the critical assets and be built from the device group, sites, application table, intent template, and CSV file, and many Column groups, which are associated with the intent and results and can be replicated primarily from the intent template. A feature table is a special ADT that is automatically created for a Golden Feature.
The following is an example of an ADT table showing all BGP devices and intents associated with the BGP devices:
An individual intent or the intents of an ADT can be run manually (e.g., running intent in the map while troubleshooting a network issue) or be scheduled to run (e.g., continuously monitoring the configuration drift). The results can be viewed in the post-execution tree of intent or through a Dashboard. A dashboard provides a network-wide observability of your network status, created by the intents.

This chapter will elaborate on the automation platform from the following aspects: