Viewing Path Log

Contents
Logs for A/B path can be checked instantly, or in saved history records.
Viewing Instant Path Log
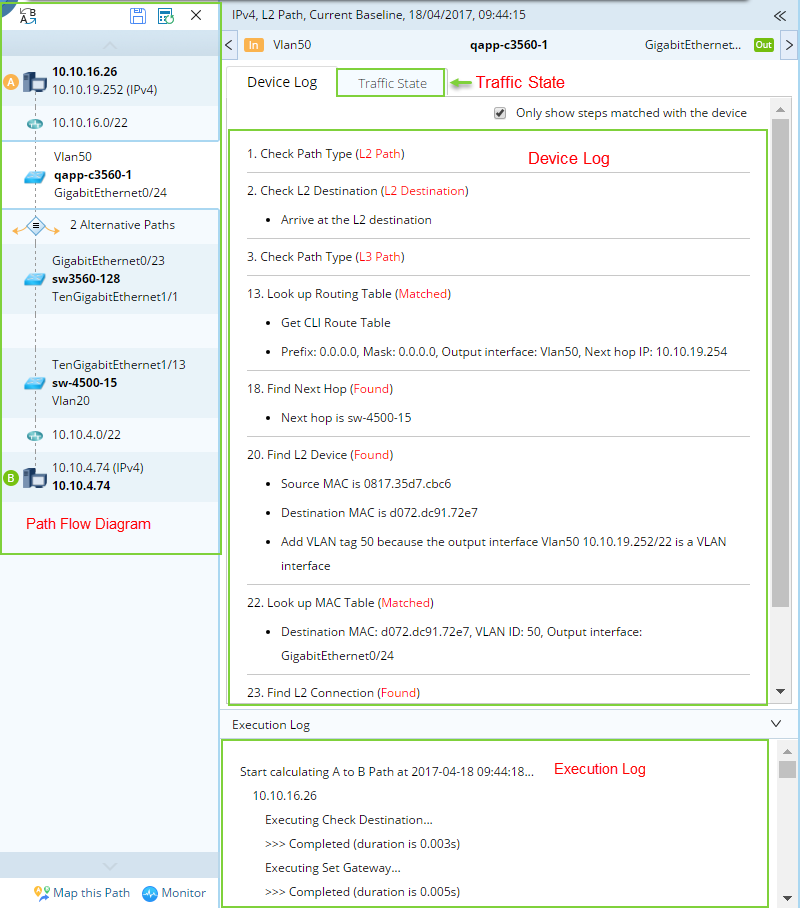
After you calculate a path, the path flow diagram is displayed. To view more information, click the  icon to expand the path log and view the device log, traffic state, and execution log in detail.
Tip: To open the path result pane again if it has been closed, click the path on the map and then click View Details.
Component |
Description |
Operations |
|---|---|---|
Path Flow Diagram |
Display each hop along a path. |
▪Click the Note: The icon is only displayed when you calculate a two-way path. ▪Click a device icon to view its device log or traffic state. And the device is also located on the map page. ▪Click the |
Device Log |
Display technologies evaluated on each device during path calculation. |
Click a device icon in path flow diagram to browse the log of the device under the Device Log tab. Or click the Tip: By default, the Only show steps matched with the device check box is selected to hide the technologies that the system failed to evaluate or that do not exist on the device. You can clear the check box to view all technology evaluating steps. |
Execution Log |
Display execution steps recorded with time stamps. |
Click the |
Traffic State |
Display the emulated traffic state reflecting the real transfer traffic status and used to find the next-hop device along the path, but that is not the real traffic state of your live network. All data is generated via show commands and user inputs. |
By default, the traffic state is not displayed. To view traffic state of the path, click the Traffic State tab. |


Viewing Historical Path Log
To view the log of a saved path:
1.Click Path Browser on the taskbar.
2.In the Path Browser, click the number in the History column of the target path entry. A floating box will prompt to display all history results of the path by time stamp.
3.Click the target time stamp and the path result pane opens with the path flow diagram displayed.
4.Click the icon to expand the path result pane. See Instant Path Log for more details.
Tip: You can instantly view the latest path log by clicking the whole path entry.
Further operations:
▪To monitor the path, click Monitor at the lower-bottom of the path result pane. See Running Qapp for more settings.
▪To draw the path on the current map or a new map, click Map this Path.
See also:
▪Path