Overall Health Monitor

Contents
Example: Run the Overall Health Monitor [SNMP] Qapp on core devices.
1.On a map, right-click to select Run Qapp from the context menu, or select Actions > Run Qapp from the map toolbar, and then select the Overall Health Monitor [SNMP] Qapp.
2.Before running the Qapp, you can select to configure the following settings:
1)Click the ![]() icon to customize target devices. By default, all devices on the current map are auto-populated.
icon to customize target devices. By default, all devices on the current map are auto-populated.
2)Select data source. The Pull Live data regularly option is automatically selected as the data source for this Qapp.
Note: In v7.1a, the data source is Current baseline by default.
3)Customize Qapp input, including threshold values of variables.
4)To share alerts with specific users, or configure message levels, click the  icon. See Sending Alerts for more details.
3.Click Run and view the result. The triggered alerts will be displayed in the Alert Console.

Tip: To save an action node and its input for reuse, point to it and click the ![]() icon to select Save as Favorite.
icon to select Save as Favorite.
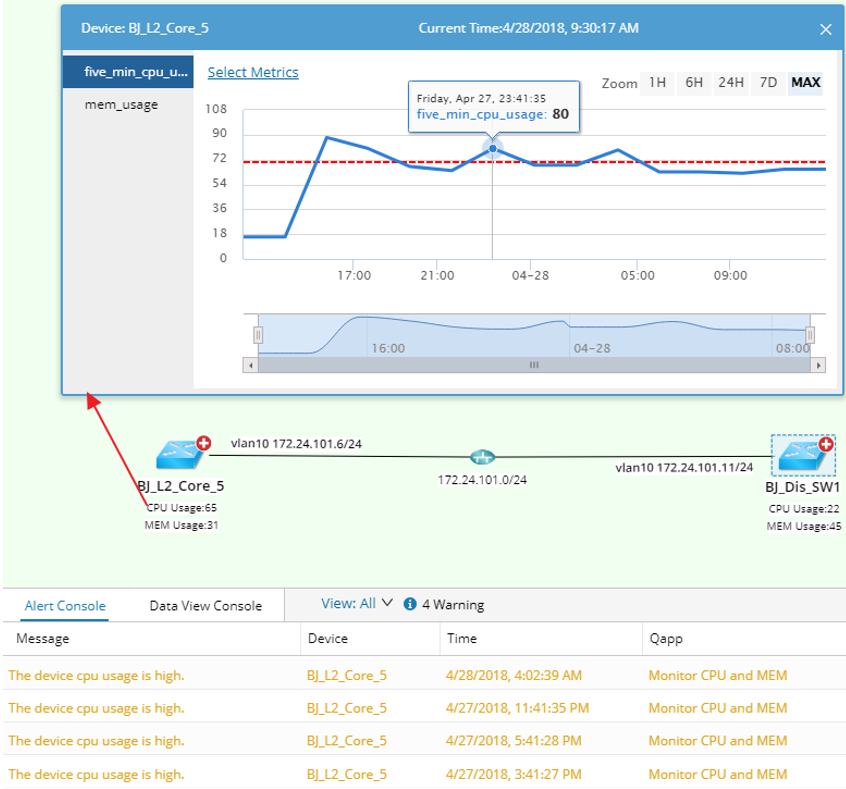
4.Click a numeric value on the map. A floating chart prompts as follows, displaying the monitoring metrics of this device during a period.
During the monitor process, the color of devices and interfaces may change, indicating the corresponding status described as follows:
Device Color |
Icon |
Description |
|---|---|---|
Green |
|
The device is stable and no alert is triggered. |
Yellow |
|
The device is unstable or the predefined warning threshold is reached. |
Red |
|
The device is down or the predefined error threshold is reached. |


Interface Color |
Icon |
Description |
|---|---|---|
Green |
|
The link is active and no alert is triggered. |
Yellow |
|
The link is unstable or the predefined threshold of warning alert is reached. |
Red |
|
The link is down or the predefined threshold of error alert is reached. |


See also: