Output Console

Contents
During a Qapp/Gapp execution, various types of outputs might be generated, depending on Qapp/Gapp definitions, including alerts, data views, CSV outputs, and execution logs. As soon as any output is generated, the Output Console auto prompts to show available outputs in a single panel, and you can monitor the execution and troubleshoot a failure/warning when it occurs.
The Output Console consists of the following tabs and information.

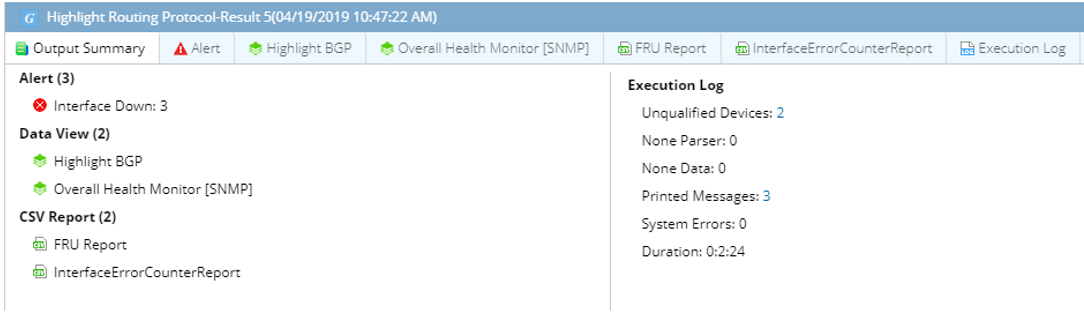
The Output Summary tab provides a general view of Qapp outputs with statistics, highlighting the following information: ▪Generated output type and its count. ▪How many outputs each output type has. ▪Key execution information, including devices’ qualifications, variable mapping, etc., to provide a basic analysis for further troubleshooting. |
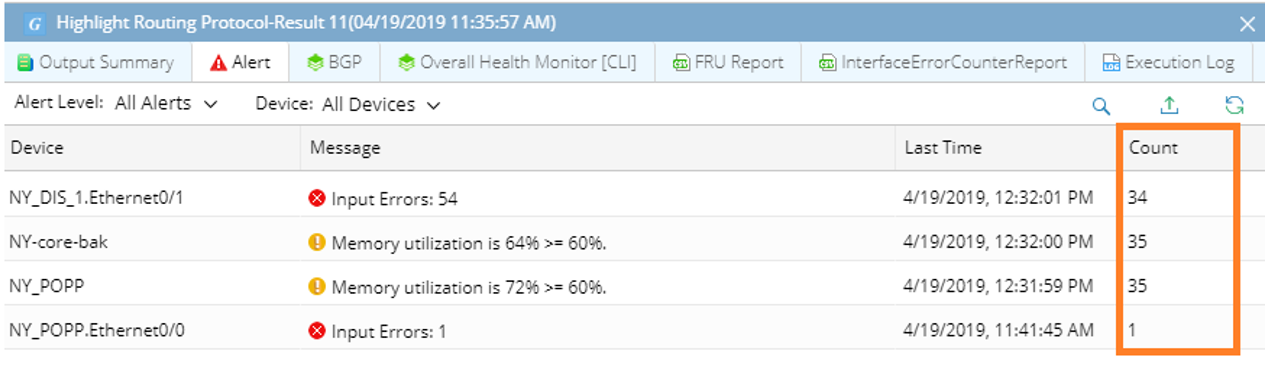
The Alert Output tab shows the events, especially alerts, triggered at both device level and interface level during a Qapp/Gapp execution. Duplicate alerts are merged into one entry, and the number in the Count column increases by 1. Event messages are categorized into four levels: Error, Warning, Information, and System. To filter messages by event level, you can click the Note: Displayed event levels might differ, depending on the selected Run Mode of Qapps/Gapps. Only events in Error and Warning levels are duplicated in the Managing Events. |
The Data View Output tab shows the metrics of devices and interfaces generated when users run a Qapp/Gapp. For numerical metrics, users can view the historical data and trend of a specific metric over a period in a chart. |

The CSV Report Output tab shows the detailed asset information. For recurring Qapps, you can further locate the exact report instance via Qapp execution time, and then export it to your local disk.
|

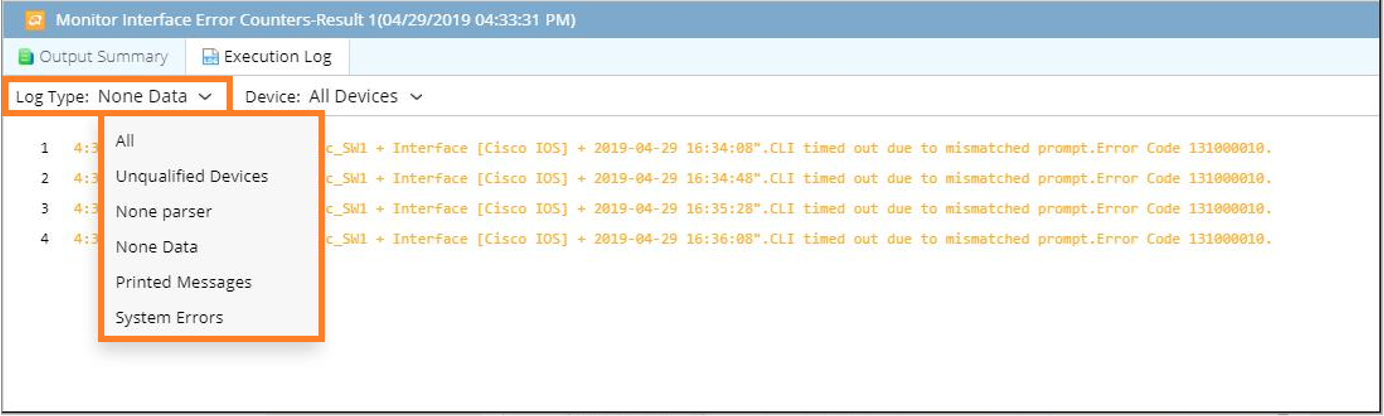
The Execution Log tab shows the detailed execution logs with error codes for root cause analysis when you run a Qapp/Gapp. It provides filters to narrow down logs based on log types and devices.
Tip: To auto-clean Qapp execution logs, refer to Auto Clean Execution Logs and More Data. |
See also: