Running Overall Health Monitor

Contents
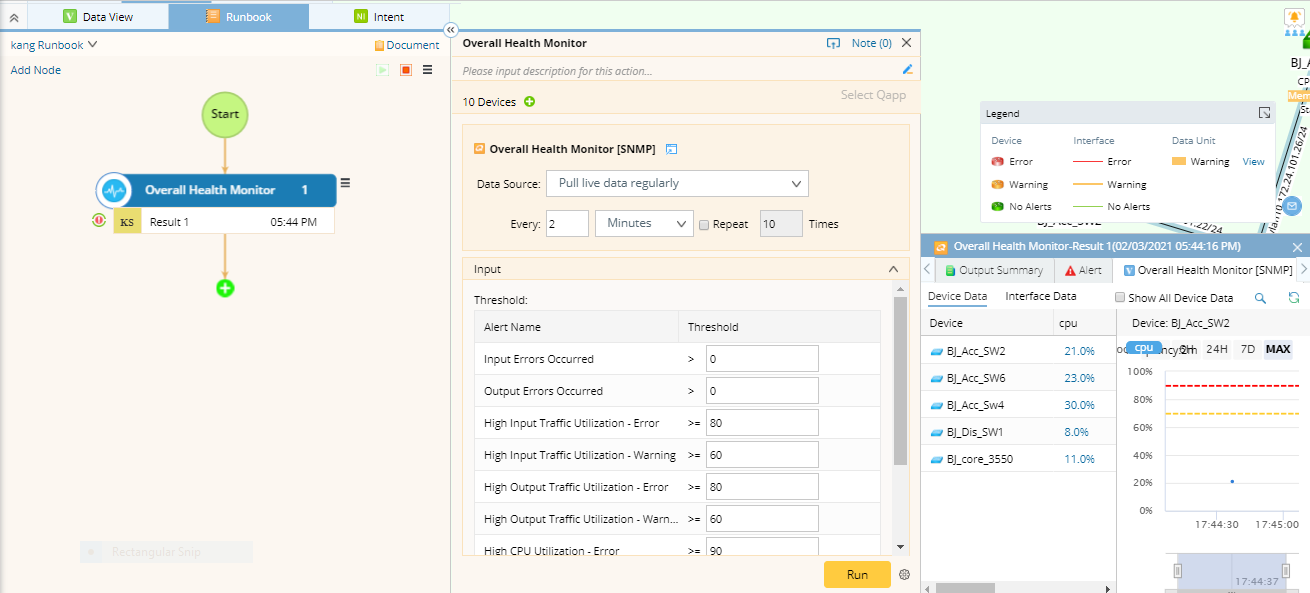
Example: Run Overall Health Monitor on core devices to get key performance metrics using SNMP.
1.On a map, select Overall Health Monitor from the right-click menu, or click Actions > Overall Health Monitor from the map toolbar. The Runbook pane opens with an Overall Health Monitor action node added.
Tip: If a runbook is open, the Overall Health Monitor action will be added to the current runbook; otherwise, it will be added to personal runbook.
2.Before running the Qapp, you can select to configure the following settings:
1)Click the  icon to customize target devices. By default, all devices and paths on the current map and are auto-populated.
2)Select Pull Live data regularly as the data source to run the monitor.
3)Customize Qapp input, including threshold values of variables.
4)To share alerts with more users via email, click the  icon. See Sending Alerts for more details.
3.Click Run and view the result. The captured alerts will be displayed in the Output Console.
Tip: To save an action node and its input for reuse, point to it and click the ![]() icon to select Save as Favorite.
icon to select Save as Favorite.
4.Click a numeric value on the map. A floating chart prompts as follows, displaying the monitoring metrics of this device during a period.

During the monitor process, the color of devices and interfaces may change, indicating the corresponding status described as follows:
Device Icon |
Description |
|---|---|
|
The value of the predefined device variable dev_status is Up. |
|
The value of the predefined device variable dev_status is Down. |


Link Icon |
Description |
|---|---|
|
The value of the predefined interface variable intf_status is Up. |
|
The defined interface variable intf_status is Down. |


Data Unit Icon |
Description |
|---|---|
|
The data unit reaches the predefined threshold of an error alert. |
|
The data unit reaches the predefined threshold of a warning alert. |


See also: