Using Data View to Decode Network Design and Troubleshoot

Contents
Data View represents a data structure to organize and visualize network information, which can be used to decode a network design or troubleshoot a network issue. By integrating with third-party systems, dynamic map powered by Data View can serve as the single pane of glass for all your network data.
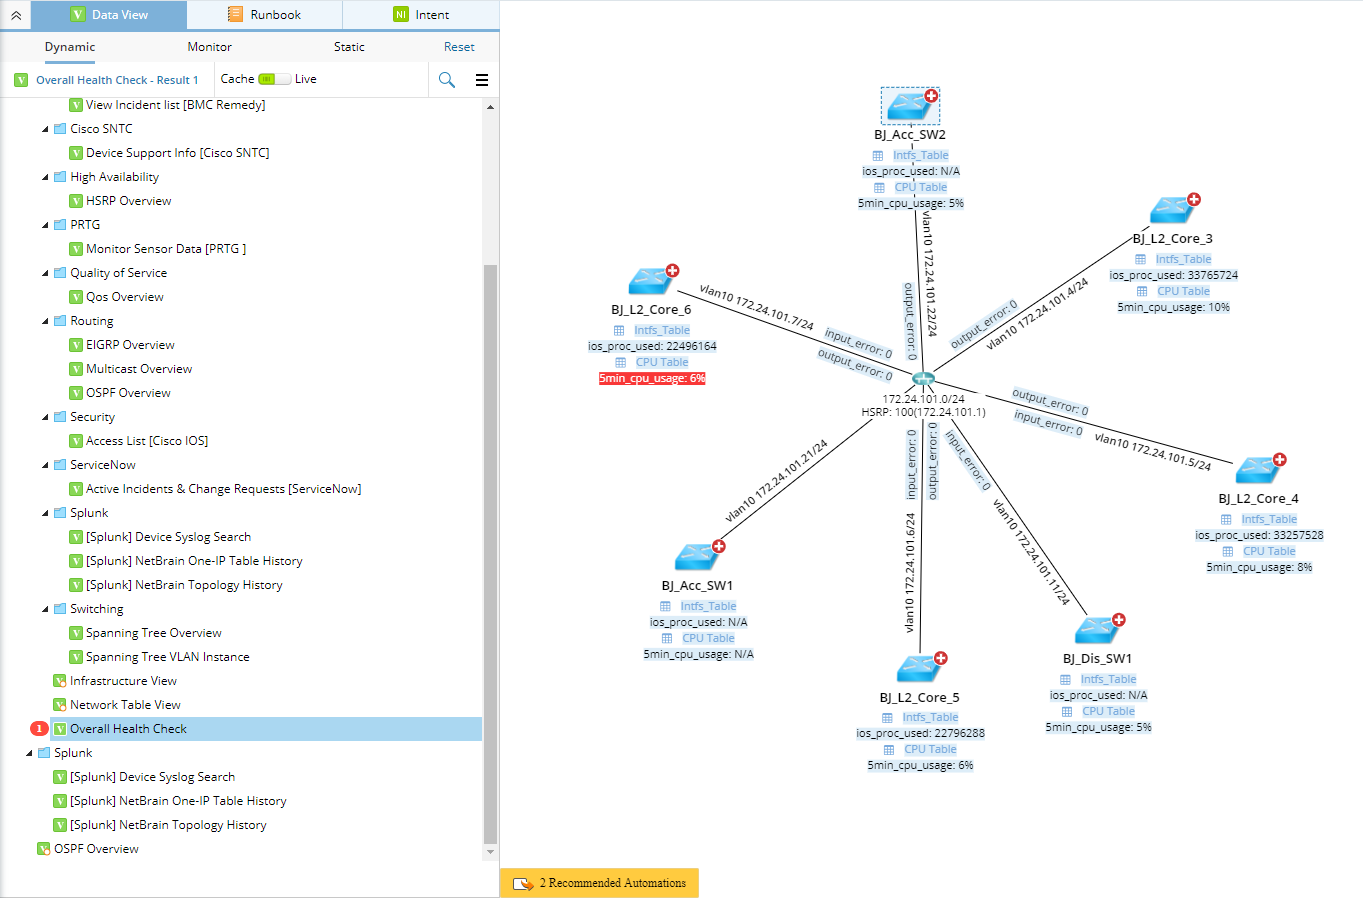
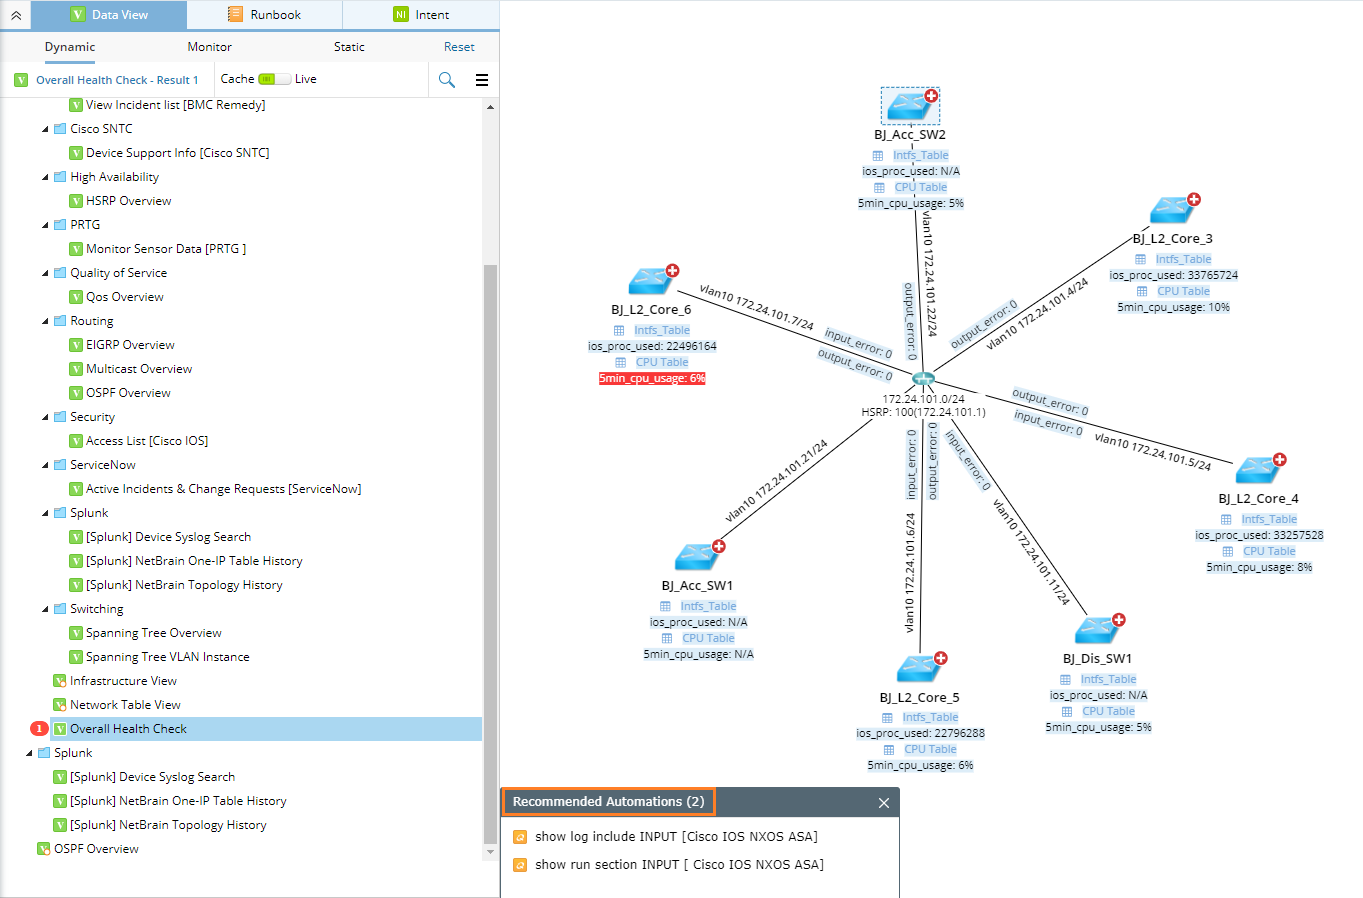
Through a dynamic data view, the system compares cached or live network data with Golden Baseline to address anomalies. Alerts can be both visualized on a map and messaged to users through system notifications and emails. Then users can leverage the recommended actions to further drill down to troubleshoot for proper remediation. Actions and results will be documented in Runbooks and can be used to collaborate with colleagues and other teams.
Reference Flow

This is a typical flow to start troubleshooting with Data View:
1.Open a Map.
2.Apply Data View Template to the Map.
3.View Data and Golden Baseline Alert.
4.View Historical Data and Execute Recommended Automations.
Use Case
▪Troubleshoot Network Issue
Based on the fundamental diagnosis, users can enclose suspicious devices that might cause the network issue in a small scope and easily proceed to the next troubleshooting level by executing the recommended recommended automations on focused devices. When users execute the recommended automation, the actions alongside the execution results will be automatically recorded in a runbook. The runbook can be shared with other users for further collaboration and escalation.
▪Decode Network Design
Apply a static data view to a map, and continuously edit the data view to make the visualized network data more valuable.
▪Single Pane of Glass
The system can retrieve data from third-party systems via APIs, and visualize the data through data views on a map. After creating a data view template with API parser, you can apply it and click a specific web link on the data view to directly go to the third-party systems for drill-down investigations and operations.
See also:
▪Integrating with Third-Party Systems