Integrating Flash Probe with 3rd Party Tool by Alert Template

Contents
In order to support the integration with the 3rd Party Tool to obtain Alert information, Alert Template can be used to process the communication with the 3rd Party Tool and perform subsequent analysis of the retrieved data.
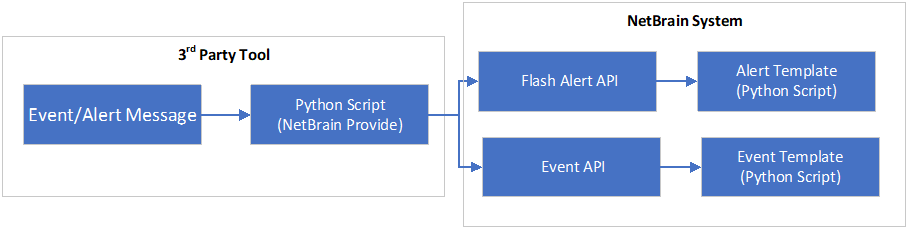
1.The script installed in the 3rd Party Tool is required as it defines how to log in to NetBrain system as well as the necessary header and message information of the alert that will be sent to NetBrain. In order to ensure the data can be processed successfully, the header information must follow the formats below:
Field Name |
Type |
Required |
Description |
sourceName |
String |
Yes |
Name of the 3rd party tool. E.g., SplunkServer1, SplunkServer2 |
sourceType |
String |
Yes |
Vendor name of the 3rd party tool. E.g., Solarwinds, Splunk |
tenantName |
String |
Yes |
NetBrain Tenant Name |
domainName |
String |
Yes |
NetBrain Domain Name |
msg |
String |
Yes |
Pre-processed raw data or structured data (from Solarwinds, Splunk, PRTG) |
2.Add an Alert Template from API Tiggered Automation Manager > API Trigger Template Manager to qualify/parse the received message and call other system functions.
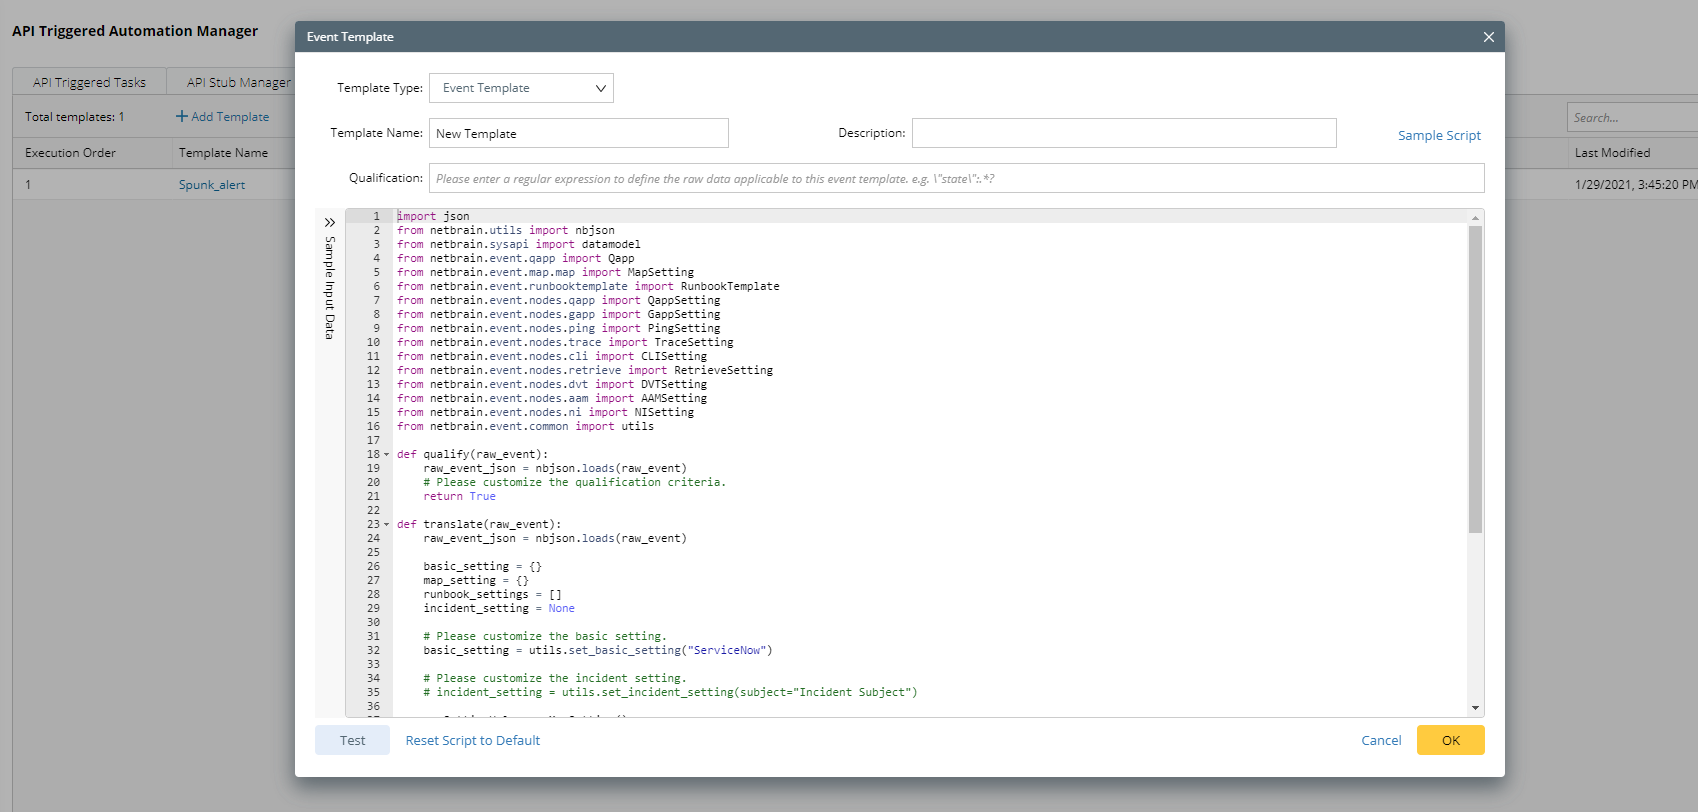
The Alert Template is used to parse the required information to generate Flash Probe and Flash Alert from msg, including:
•Alert Name: As the key to generate and search the Flash Probe in Adaptive Monitoring, the Alert Name shares the same value with the Flash Probe Name.
•Device/Interface Info: Device and Interface data retrieved from the Alert/Change Information.
•Time: The time when the current Alert occurred.
•Alert Content: The Alert Content will be displayed when the corresponding Decision Tree is activated.
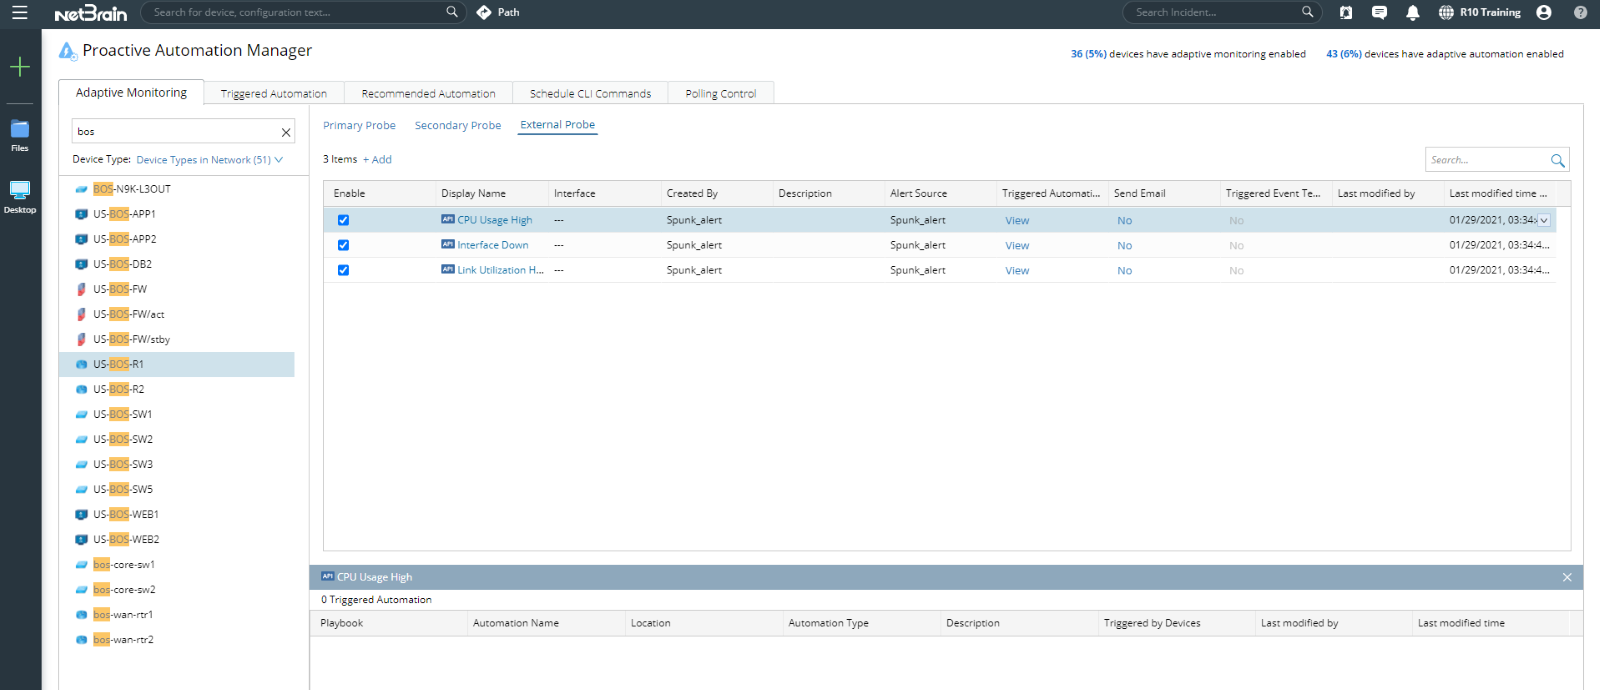
3.The Alert received from the 3rd Party Tool will automatically generate an External Probe, which can be viewed in Proactive Automation Manager > Adaptive Monitoring > External Probe.
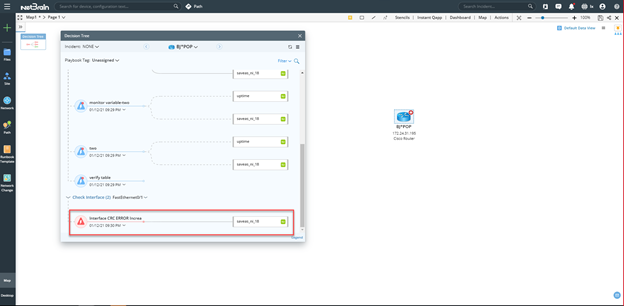
4.If follow-up automation is defined for External Probe, you will be able to view the detailed information in the Decision Tree once the alert is received. Refer to Viewing Flash Probe Results for more details.
View Flash Alert and Data Cleaning
The Alert information received from the 3rd party Tool will be displayed in the API Triggered Flash Alert tab.
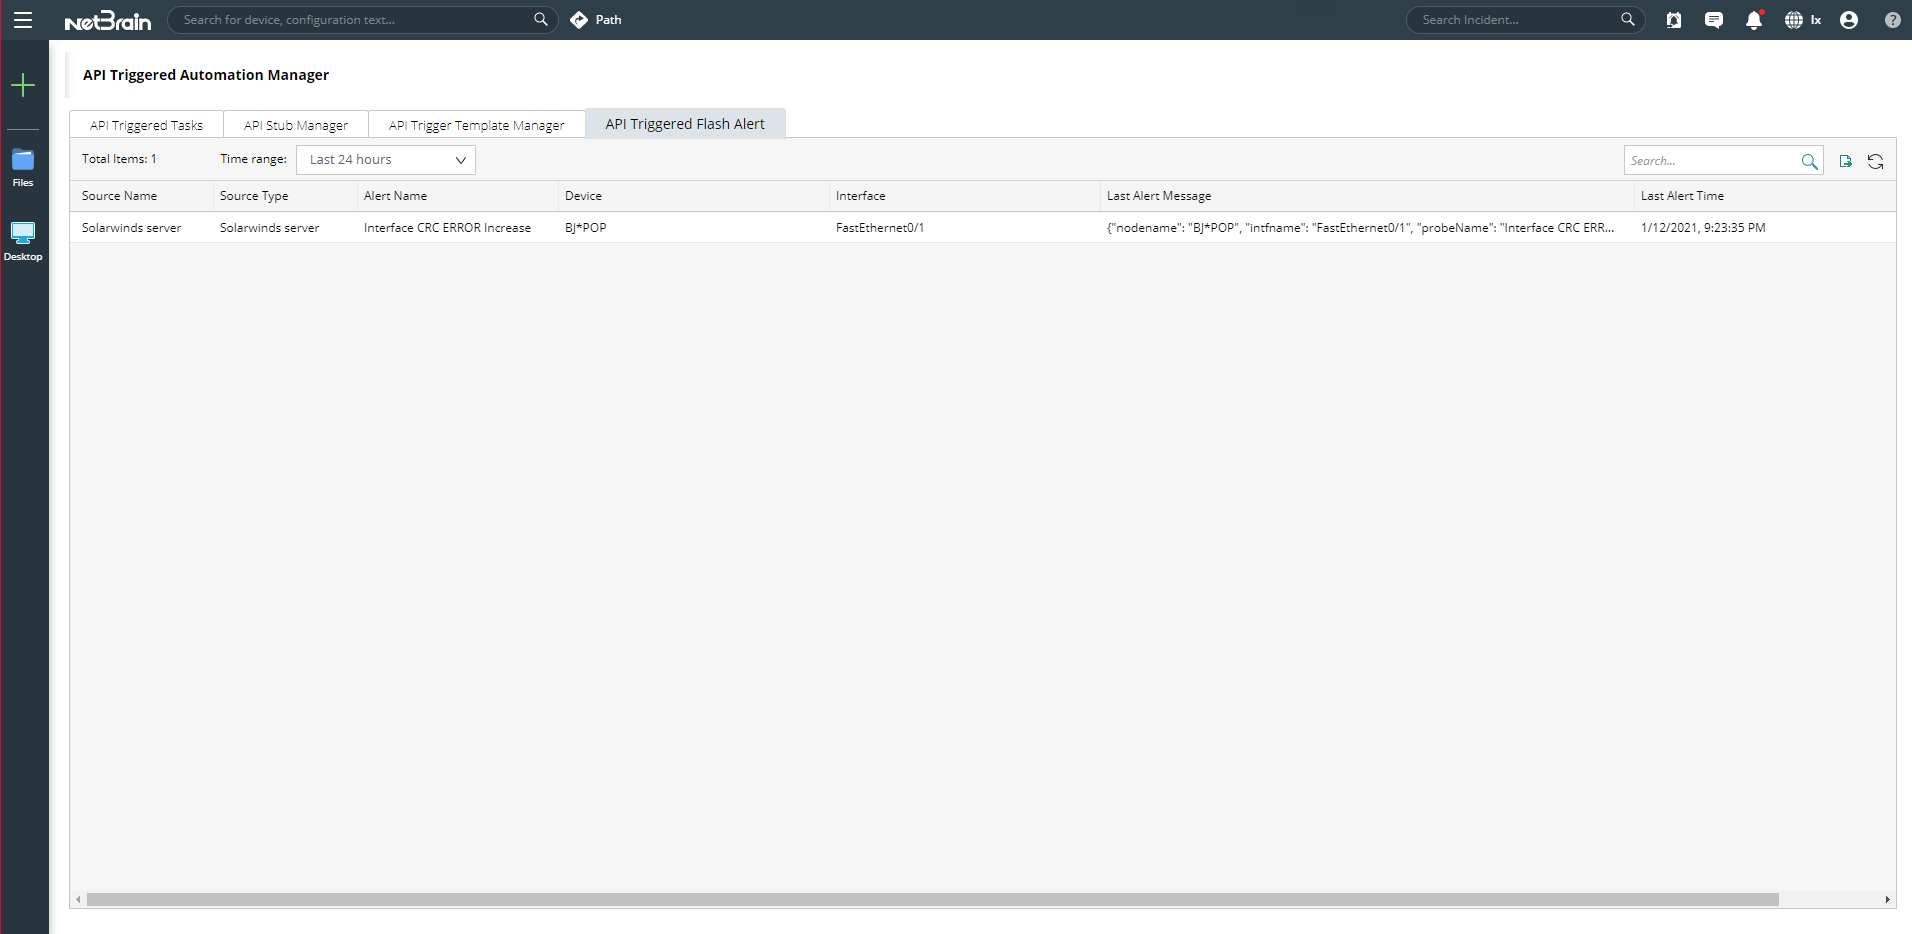
The definitions of each property column are listed as follows:
•Source Name: The value of the sourceName field retrieved from the header information.
•Source Type: The value of the sourceType field retrieved from the header information.
•Alert Name: The key of the Alert, which corresponds to the Flash Probe Name.
•Device: The hostname of the Device that generats the alert.
•Interface: The name of the corresponding Interface of an interface level alert.
•Last Alert Message: The most recent Alert Content of the Alert.
•Last Alert Time: The time when the Alert was last generated.
•Alert Counts: The total counts of the alerts. (Note: This property is only for display purposes- does not support clicking to view more details.)
Tip:
1)Viewing alert based on time range is supported.
2)Export operation is supported- you can export the contents of the current Table to CSV File.
3)Considering the potential large number of Flash Alerts and the massive storage space required for Mongo DB, an API Triggered Flash Alert option is available in Global Data Clean Settings. The default setting is disable. If enabled, Flash Alert data older than 3 months will be deleted by default.
See also: