R12 Publication-2025July16
Operations on Chart
Display of Count of Intent/Count of Status Code/Count of Row:
one of the three options will be shown to tell what type of data is displayed in the Chart.
- Count of Intent: The chart will show the data for each intent (including count of status code, count of no status code and count of empty cell).
- Count of Status Code: The chart will show only the count of status code of intent (including alert/success).
- Count of Row: The chart will show the row count for each defined group.
Filter Chart Data via Legend Field
The Checkbox in the Legend field can control whether the corresponding data will be displayed in the Chart. The four options are indicated by different colors respectively.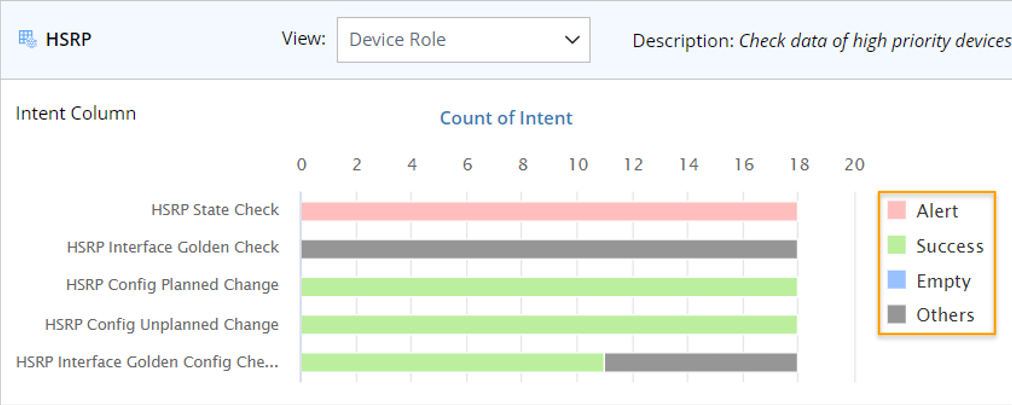
- Success (green color): The count of intents that only have success status codes.
- Alert (red color): The count of intents that have only at least one alert status code.
- No Status Code (blue color): The intent with no diagnosis results.
- Empty Cell (grey color): The count of empty cell in column.
Filer Chart Data via Color Block in Chart
Click a color block in the chart, the data in the table structure below will be filtered according to the type of data designated by the color.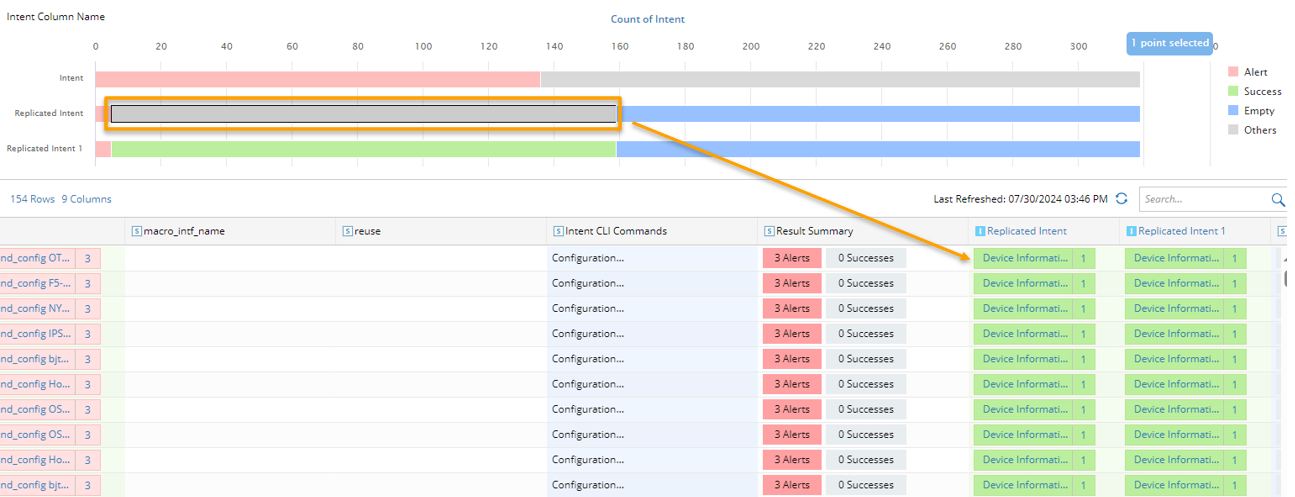

|
Tip: Press the Ctrl key to select multiple color blocks at a time. |