Define Pivot Table
- To analyze large amounts of data in Report by summarizing it into a more manageable and meaningful format.
- To assist in defining the Dashboard by providing the data needed for Dashboard charts
Follow the steps to define a pivot table:
Define Pivot Table Rows
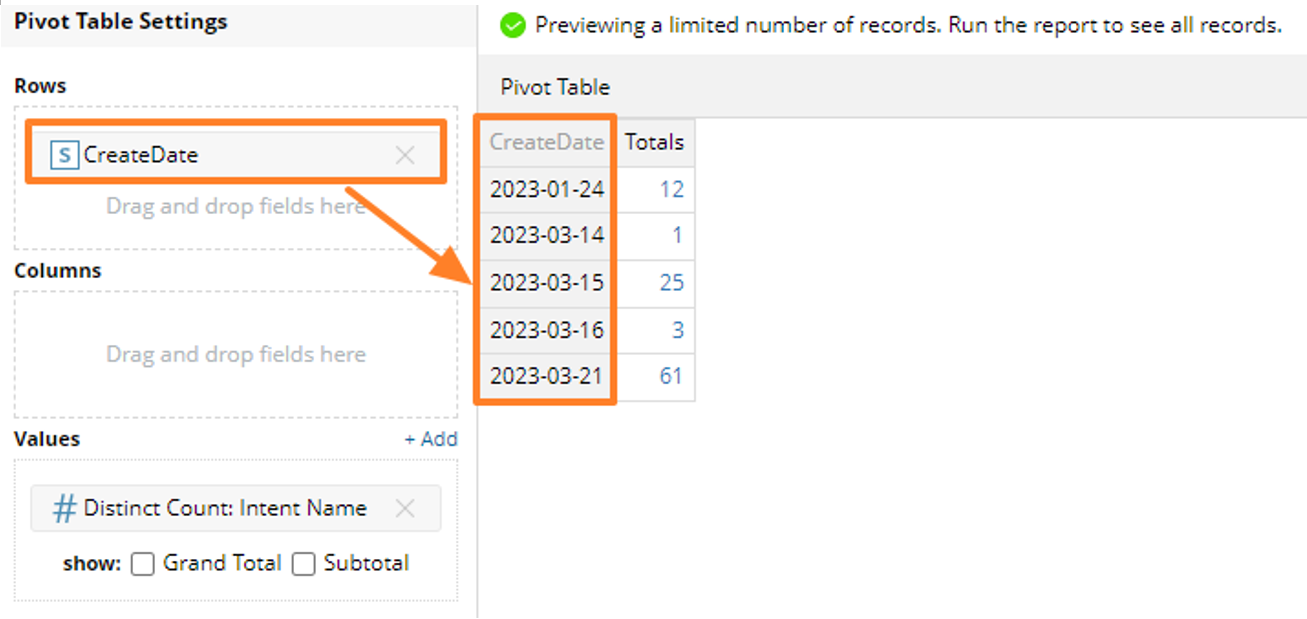
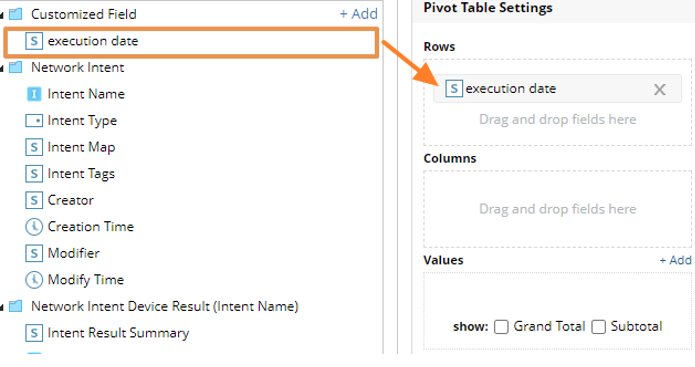
You can drag and drop the report field to the Rows in Pivot Table Settings.
The rows in Pivot Table represents the categories by which the data is grouped and summarized. Any available fields in the Report Field Tree can be used as Pivot Table rows.
As illustrated in picture below, the Rows for Pivot Table will become the first column in Pivot Table.
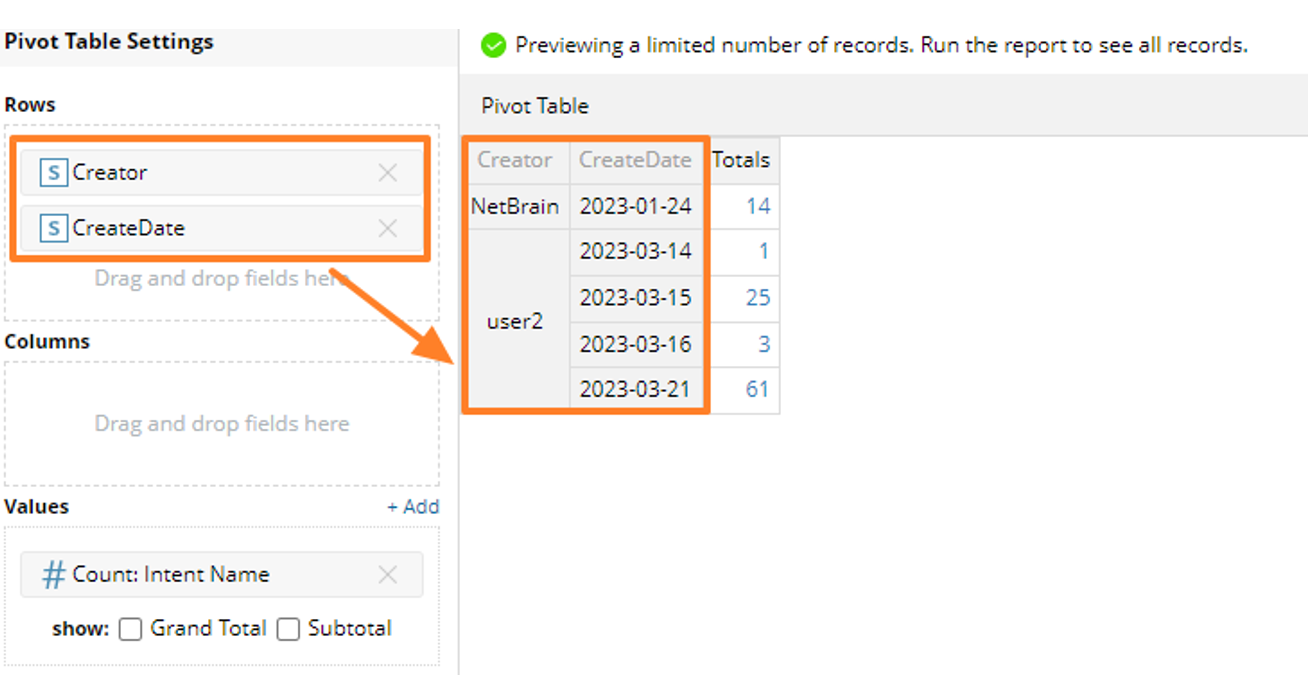
A Pivot Table can possibly have multiple grouping by rows. It provides multi-layer of data grouping and can be used to drill down into more details. Each Pivot Table can have up to four groupings by Rows or Columns in total.
When there are multiple rows in a Pivot Table, the data is grouped hierarchically based on the order of rows. Each row represents a level of grouping, with the first row being the highest level and the last row being the lowest level.
As illustrated in the picture below, the Pivot Table will group the data first by Creator, then by CreateDate. Each Row will represent a level of grouping, with the Creator row being the highest level and the CreateDate Row being the lowest level.
Define Pivot Table Columns
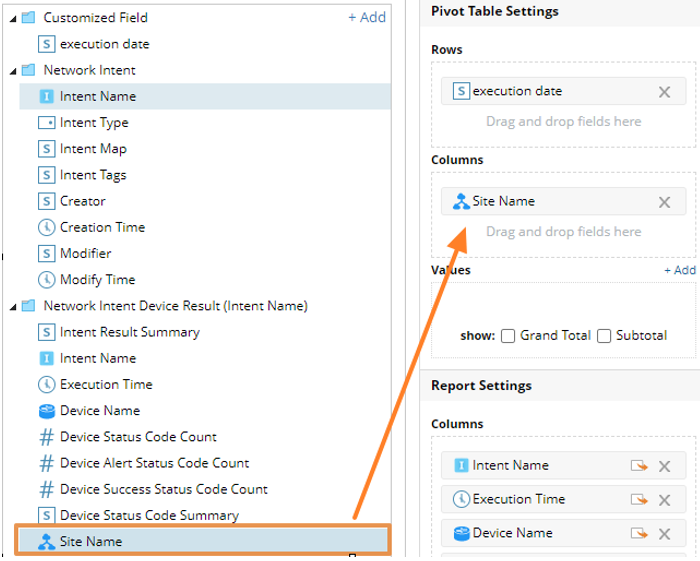
You can drag and drop the report field to the Columns in Pivot Table Settings.
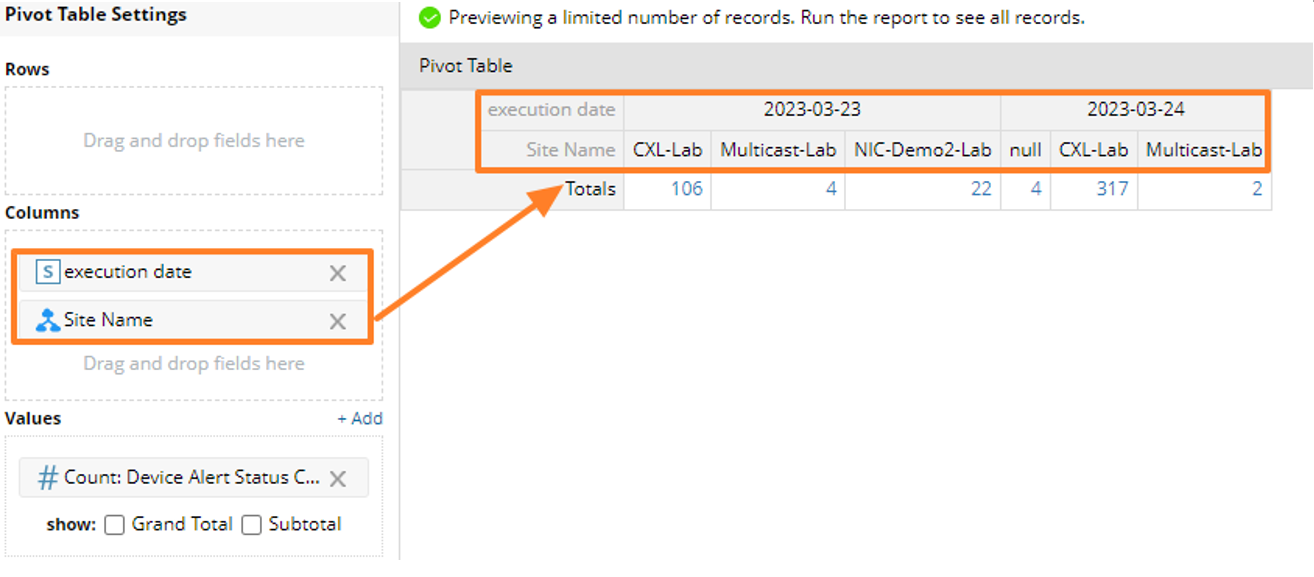
The Column in Pivot Table also allows you to group data by certain report fields. Pivot Table Columns provides another way to aggregate data and can help you identify important trends that may not be obvious when viewing data by rows. When grouping by columns, the Pivot Table will create a new column for each unique value in the selected report fields. The Pivot Table will then display the summary data for each column.

Pivot Table can have multiple groupings by columns. When there are multiple columns in a Pivot Table, the data is grouped hierarchically based on the order of columns. As illustrated in the picture below, the Pivot Table will group the data first by execution date, then by Site Name.
Define Pivot Table Values
In Pivot Table, the Values are the numerical data that is being summarized and displayed.
When defining values for Pivot Table, you can choose one or more report columns to use as Values. Then you can also specify the calculation method for the Values, such as sum, average, minimum, count, etc. The available calculation method varies depending on the data type of the Report Field selected.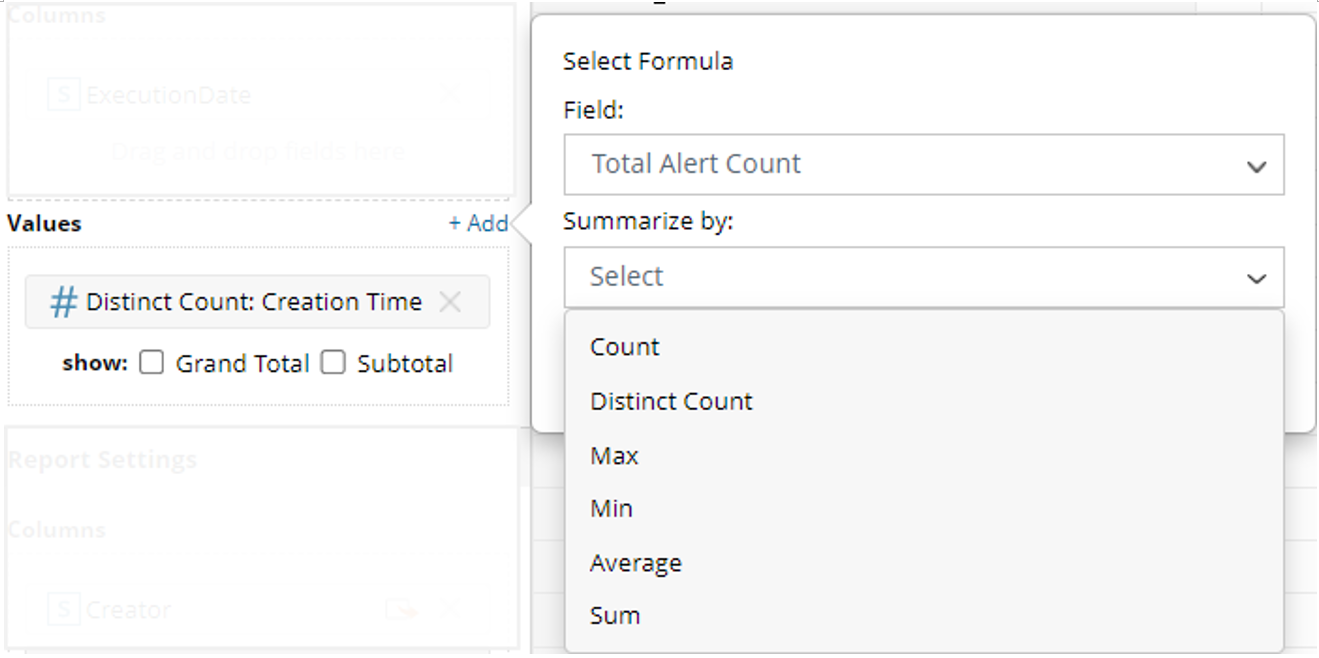
If the data type of the selected Report Field is non-numeric, then there are two methods to choose from:
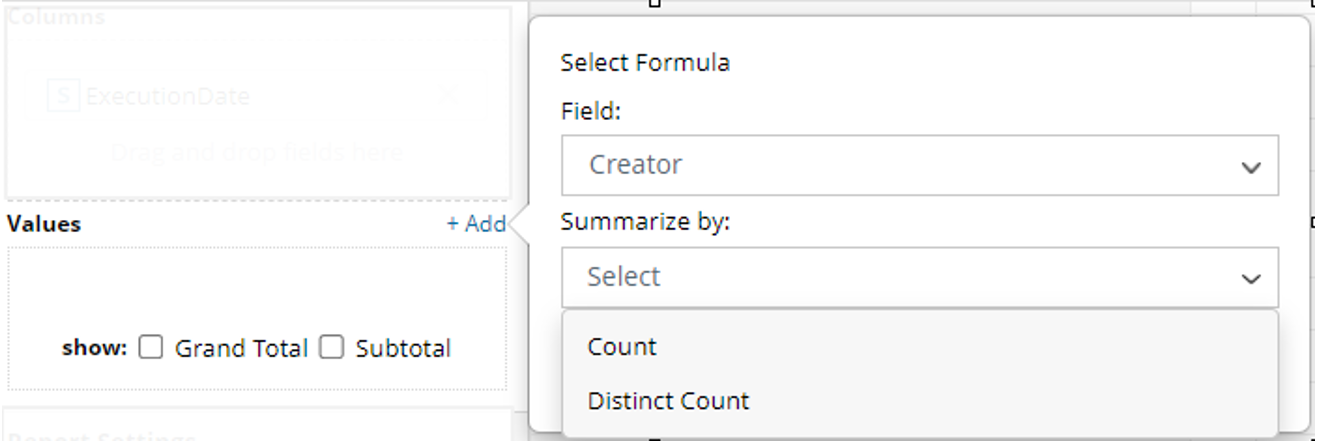
These Values are displayed in the body of the Pivot Table, with Rows and Columns defining the categories or dimensions that you want to analyze.

Example: Build a Pivot Table for Intent Alerts
Example: Create a Pivot Table to summarize the number of Intent Alerts by site name and execution Date.
Follow the steps below to define the Pivot Table:
-
Drag and drop Execution Date from Report Field to Pivot Table Rows.
-
Drag and drop Site Name from Report Field to Pivot Table Columns.
-
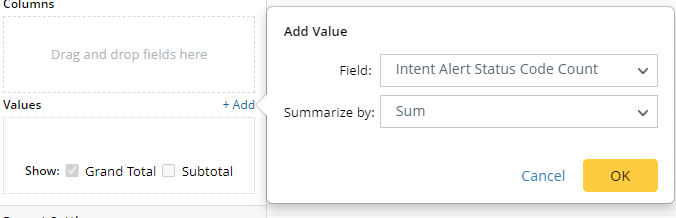
Click Add to define Pivot Table Values: Select Intent Alert Status Code Count as Report Columns, select Sum as Method, then click OK.
-
Refresh to view the Pivot Table.
