Output Console
Output Console Overview
During the execution of a Qapp or Gapp, various types of outputs may be generated depending on the Qapp/Gapp definition. These include alerts, data views, CSV reports, and execution logs.
As soon as any output is generated, the Output Console automatically opens to display the results in a single panel. This allows you to monitor the execution in real time and troubleshoot any failures or warnings as they occur.
The Output Console consists of the following tabs and information.
-
Output Summary: Provides a general overview of the execution output with the following key information:
- Types of outputs generated and their counts.
- Count of instances per output type.
- Key execution metadata, such as device qualifications, variable mappings, and other indicators to support basic troubleshooting.

-
Alert: Displays events and alerts triggered at the device or interface level during Qapp/Gapp execution.

Note: The availability of event levels may vary based on the selected Run mode. Only Error and Warning level events are duplicated in the Managing Events view.
- Duplicate alerts are merged, and the Count column increments accordingly.
-
Alerts are categorized into four levels: Error, Warning, Information, and System. Use the
 icon to display events by severity level.

-
Data View: Presents device and interface metrics generated by the Qapp/Gapp execution. For numeric metrics, historical data and trend charts are available, enabling performance analysis over time.

-
CSV Report: Lists detailed asset-related data in CSV format.
For recurring Qapps, each report instance is indexed by execution timestamp.
Reports can be exported to your local system for further analysis.

-
Execution Log: Displays detailed logs of the Qapp/Gapp execution, including error codes for root cause analysis. Filter logs by log type and device to narrow down the data.
Tip: To automate log cleanup, refer to the Clean Domain Data section . 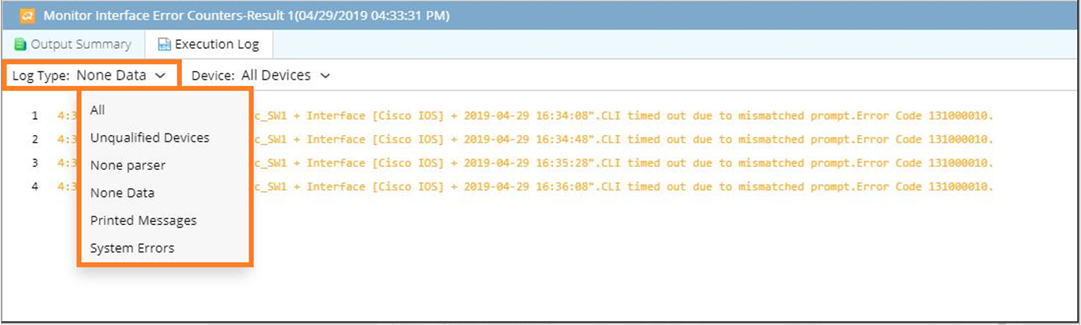
See also: