Messages Tab
The Messages tab enables you to exchange messages and share various contents. You can post instant messages on the Messages tab, pin important messages on the top for portal users, and review messages triggered from PDAS.
Normal Messages
You are encouraged to post messages to communicate your ideas or findings in the troubleshooting process with colleagues.
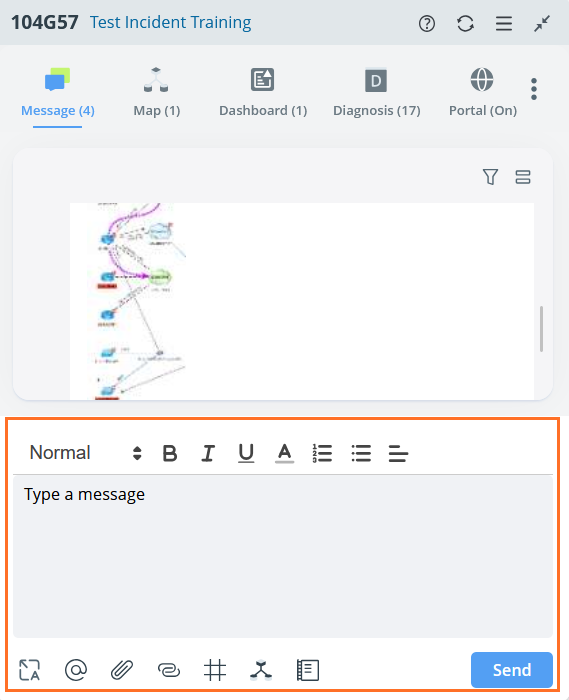
In addition to text messages, the incident pane offers more options to enrich the message, for example, mention a device or user in the current domain, insert a URL as a link, or insert a runbook execution result.
| Icon | Description |
 | Used to input interactive information and adjust the format layout. |
 | Used to add devices, then you can click to view device data. |
 | Used to mention users in the system. |
 | Used to upload local files as attachments. |
 | Used to insert a URL for reference. |
 | Used to insert map links. |
 | Used to insert runbook results |
- Type a message in the typing field and click Send, the message will be post.
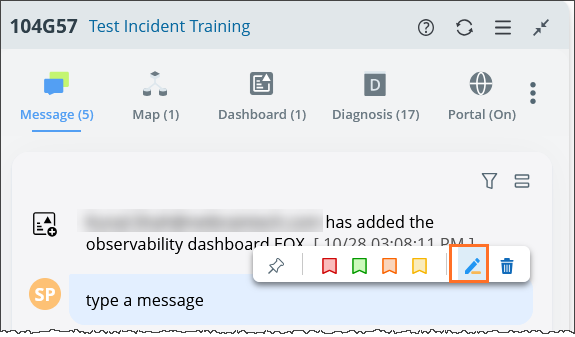
- Edit/Delete Message: you can edit and delete your messages.
Find Message
To enhance collaboration with messages, you can publish a message and findings from other function modules to an incident. The signature of a published message indicates the source of the message.
- From PA Dashboard - Execution Tree: you can publish a flagged message to an incident for collaboration. Clicking the link at the lower-left corner of the published message will locate the specific execution tree node.

- From Runbook: you can publish a Runbook node or a Runbook execution result to an incident for collaboration. Clicking the link at the lower-left corner of the published message will locate the specific runbook node.
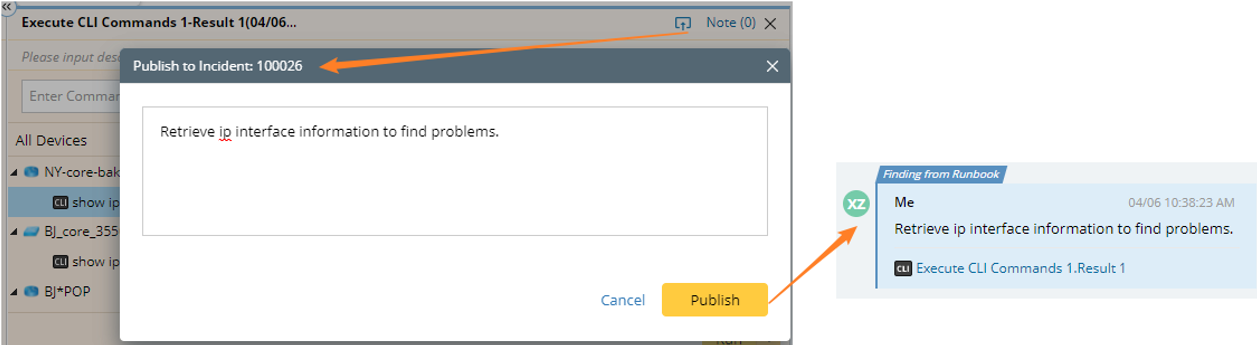
- From Smart CLI
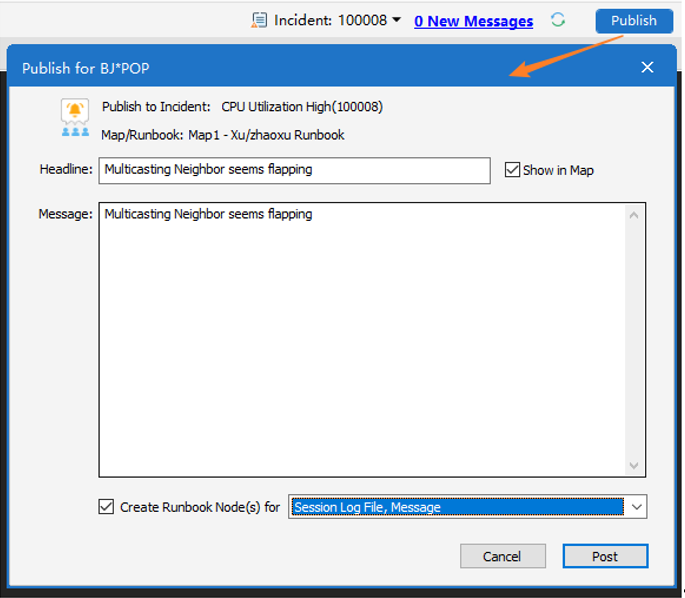
With an incident associated, you can publish device-specific findings to the Incident for collaborative troubleshooting. The contents that can be published to an incident include:- Text Message – displayed as a message in the collaboration session and as a device note on a map (optional).
- Command Output Message – displayed as a particular type of message in the collaboration session.
- Session Log File – displayed as an attachment in the collaboration session.
- Runbook CLI Node – created for the specified device and command output.
- Runbook Free Text Node – created for the specified message.

Mark Message
The system supports four colors to mark messages, allowing you to pay attention to the marked messages and better know what further actions to take.
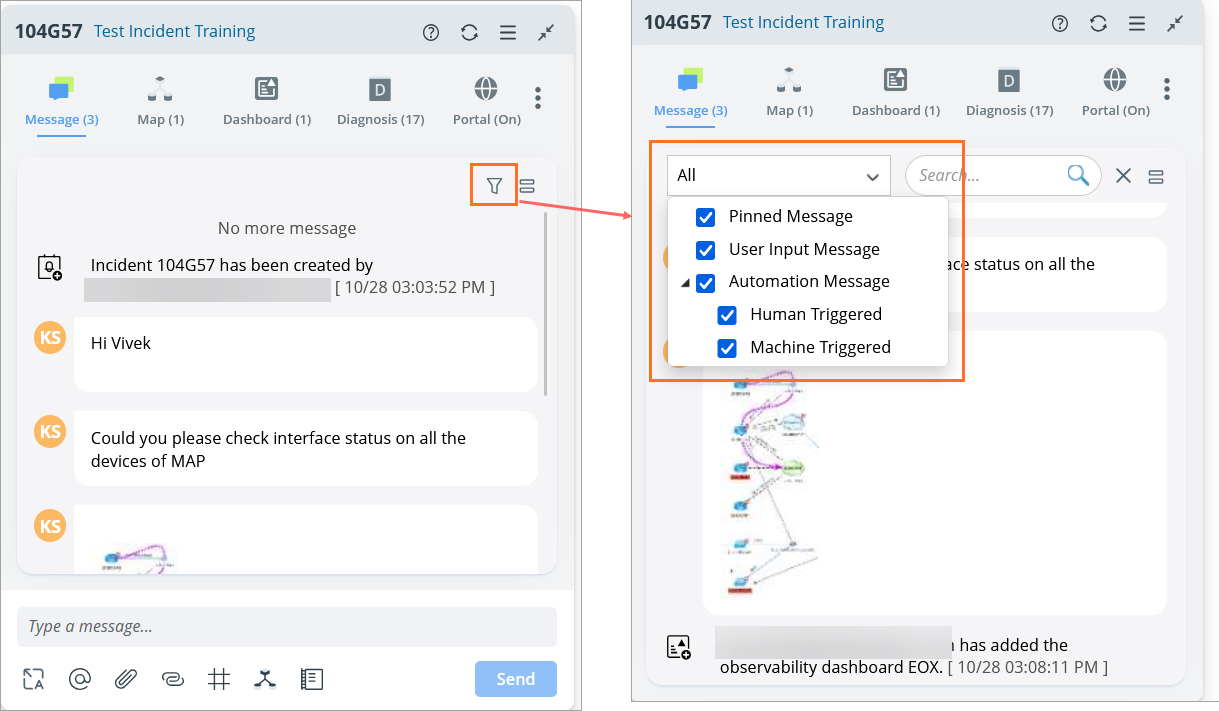
Filter Message
An Incident Message pane supports the following filters to make the incident pane more user-friendly and tailored to different audiences:
- All: Shows all messages. This is the default selection. When all options are unchecked, no messages are displayed. System messages are not listed separately but appear when "All" is selected.
- Partial Selection: Displays abbreviations for the selected categories at the top, such as "Pinned," "User Input," etc.
- Automation Message: If selected, it displays "Automation."
Message Catagories:- User Input: Includes user-type and finding messages.
- Human Trigger: Refers to messages generated by self-service runs.
- Machine Trigger: Refers to messages triggered by systems, such as those generated by TAF.

|
Note: The system message is not in the filter scope. |
You can also locate the filtered messages in the view of all messages. Hover over the message to view the options.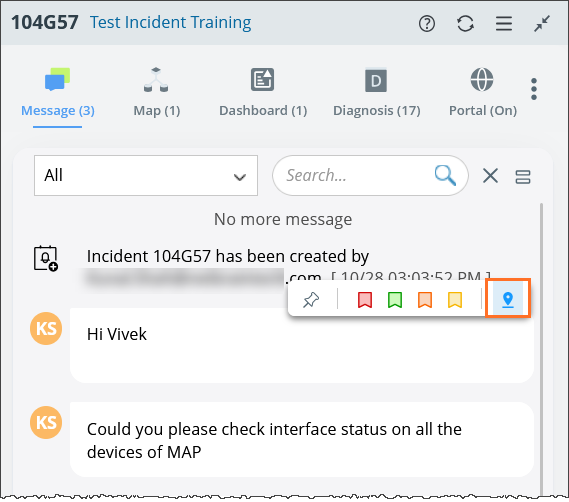
Pin/Unpin Message
You can pin messages to put essential messages generated in the troubleshooting process on the top. A message in the message pane can be pinned by clicking the icon.
icon.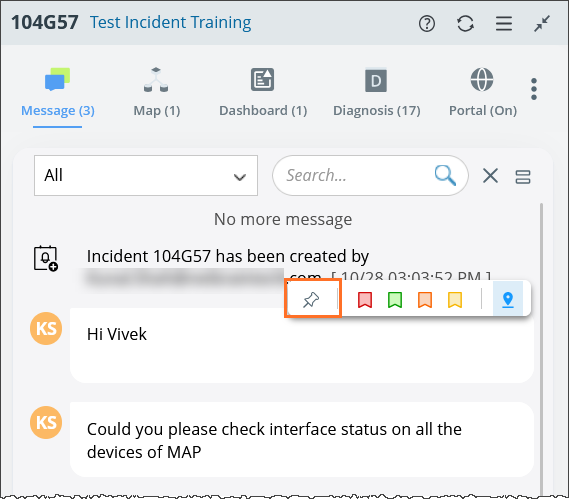
If one or more messages are pinned, the Pinned Messages pane appears on the top, displaying all the pinned messages.
A pinned message is described as follows:
- A pinned message is visible in both the NetBrain system and the incident portal.
- Display the time when the message is pinned and the user who pinned the message.
- The pinned messages under the pinned message title are listed in time order (the most recently pinned message is placed on the very top of pinned messages).
- The maximum number of pinned messages for an incident is limited to 100.
- Updates of the pinned messages are synced to the incident portal and also displayed in the NetBrain System.
You can unpin a message in the system by clicking the  icon on the pinned message. A pop-up message will prompt you to confirm the unpinning action.
|
|
Note: Pinning/unpinning messages are not allowed in an incident portal. Portal users can only view the status of messages in the incident portal. |
Only the first line of the message contents is displayed for a pinned message.
|
|
Note: Web incident users do not have to get the pinning right to pin/unpin messages. |
Two Modes for Messages in the Incident Pane
The collapsed mode and the expanded mode for incident messages are supported in the Incident pane and portal. You can switch between the two message modes by clicking the ![]() icon at the upper-right corner.
icon at the upper-right corner.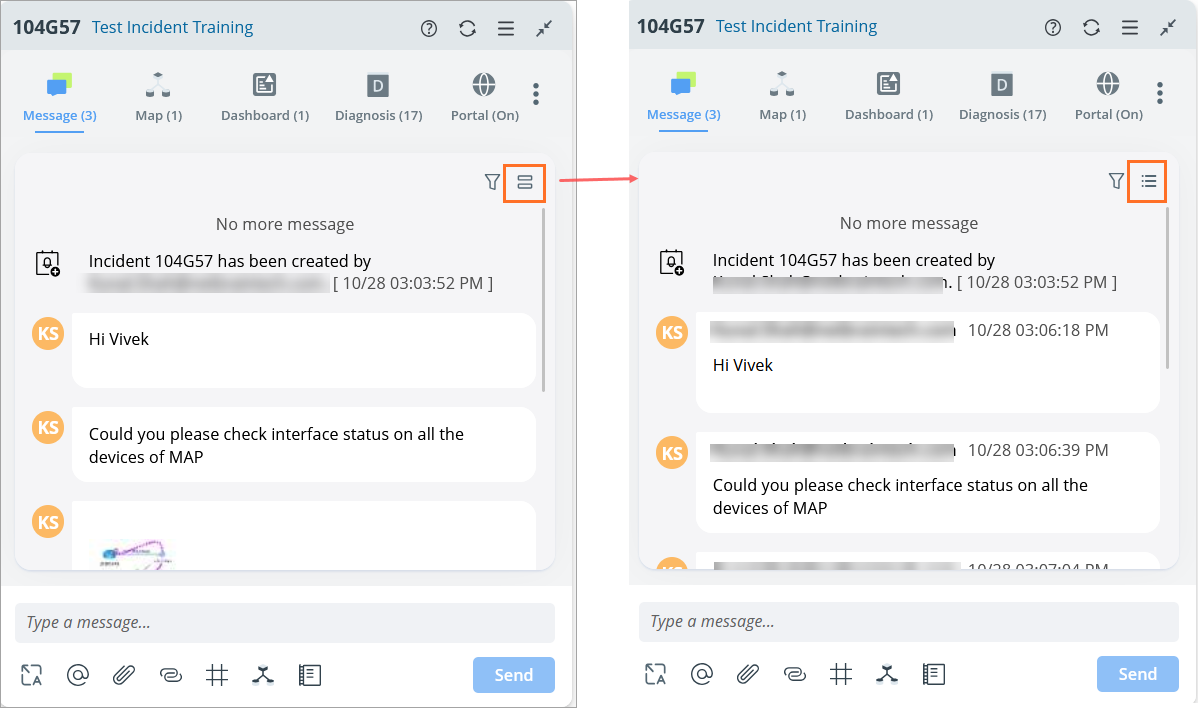
- Collapsed mode (default mode): Only the header and signature of a message are not displayed. Also, you can view more conversations in the incident pane in the collapsed mode. For the edited, marked, and pinned messages, the headers are reserved in the collapsed mode so that you can view the time of the operation on the messages.
- Expanded mode: Each message is fully displayed, including its header and signature. You can view all the details of the message.
Open the Diagnosis Tree from NI Diagnosis Output Message
If an output message is generated from NI diagnosis, which might be executed manually or by Trigger/Preventive automation, a Diagnosis Tree icon is shown in the output message. You can open the NI Diagnosis Tree by clicking the icon. The Diagnosis Tree displays all the NI diagnoses. If the NI calls other follow-up NI diagnoses to do multi-stage reasoning, all the follow-up NI diagnoses can also be shown here.
|
|
Note: All power users can operate on the output messages generated from NI diagnosis to open the Diagnosis Tree. Your information text here. |