View Observability Dashboard

Types of charts in the observability dashboard:
Summary Chart
The summary chart appears at the top of the observability dashboard. It summarizes the key metrics for the entire observability dashboard.

| Name | Meaning | Note | ||
| Number of Intents | The total number of intents in the observability dashboard, adding together the intents in all Result Detail Charts |
|
||
| Number of Devices | The total number of intent devices on the observability dashboard, adding together the intent devices in all Result Detail Charts |
The repeated Intent devices will be excluded from the total number.
|
||
| Number of Alerts | The numerical sum of alert status code counts on the observability dashboard, adding up the intent alert status code count and device alert status code count | The same alert will be counted twice if it appears in different rows of this observability dashboard. | ||
| Number of Successes | The numerical sum of success status code counts on the observability dashboard, adding up the intent success status code count and device success status code count | The same success will be counted twice if it appears in different rows of this observability dashboard. |
All numbers will be recalculated when the observability dashboard is refreshed/reopened.
Top-N Chart
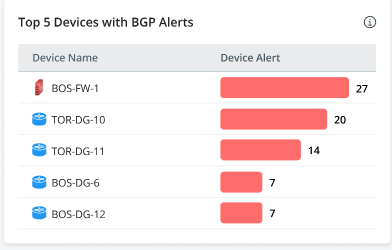
Top-N Chart helps users to instantly spot devices that require attention even when the observability dashboard has plenty of result detail charts. The Top-N Chart lists a certain number (defined by users) of devices with the most alerts in descending order.
- View and understand the chart.
- The alerts are calculated using the device alert status code across Intent Dashboards in selected dashboard groups in the observability dashboard.
-
Users can hover over each device alert bar to view a breakdown of the alerts by dashboard groups.

-
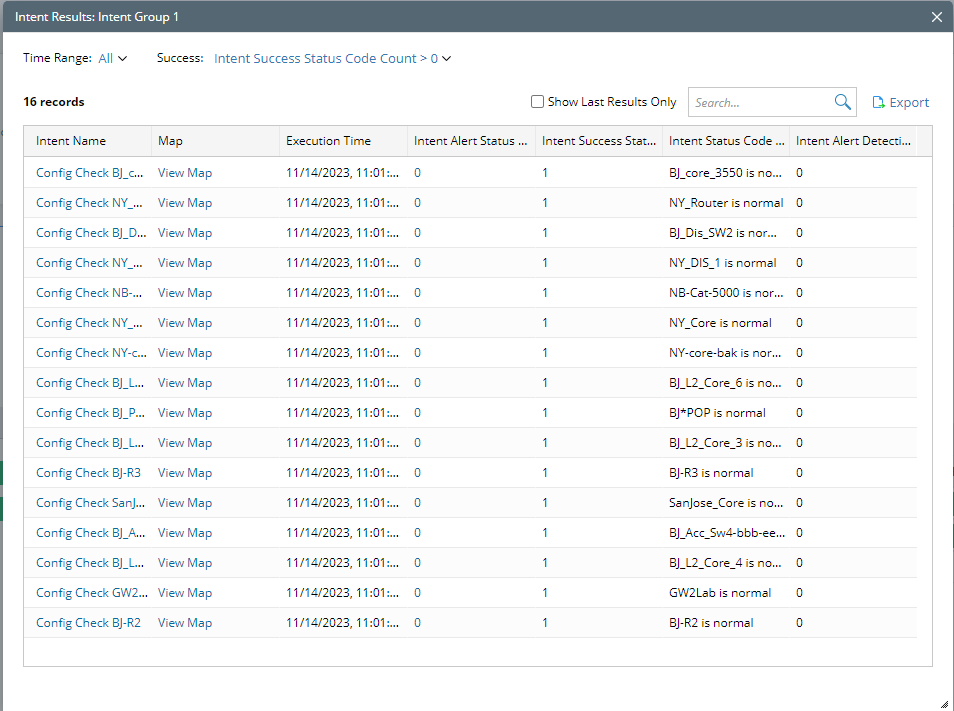
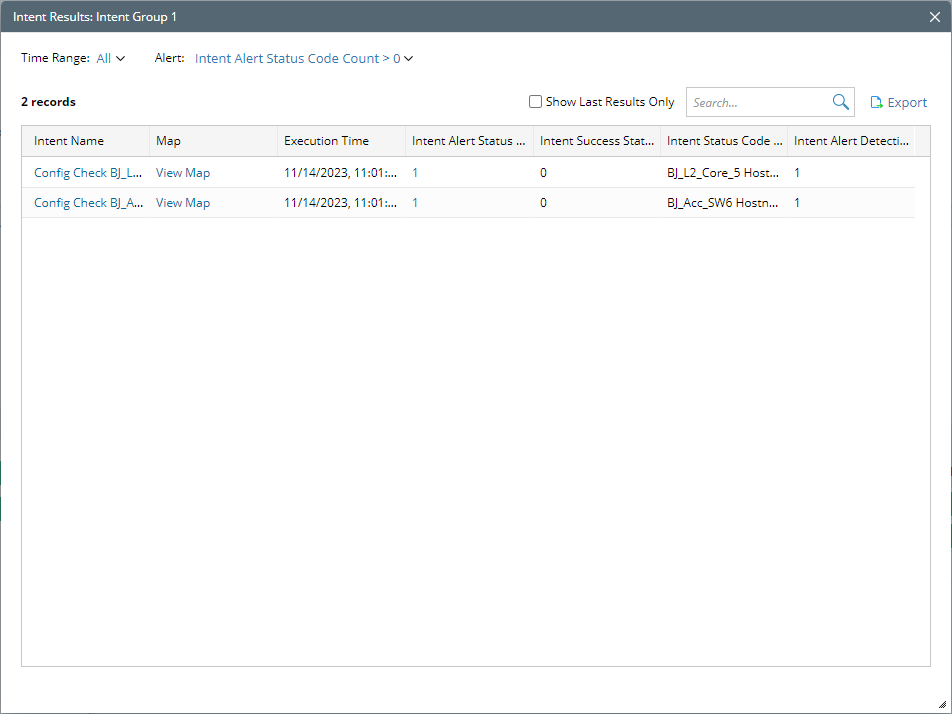
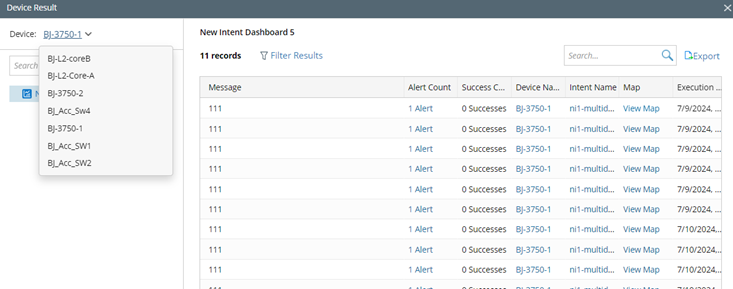
Open the drill-down report to inspect the alerts by clicking the red bar.
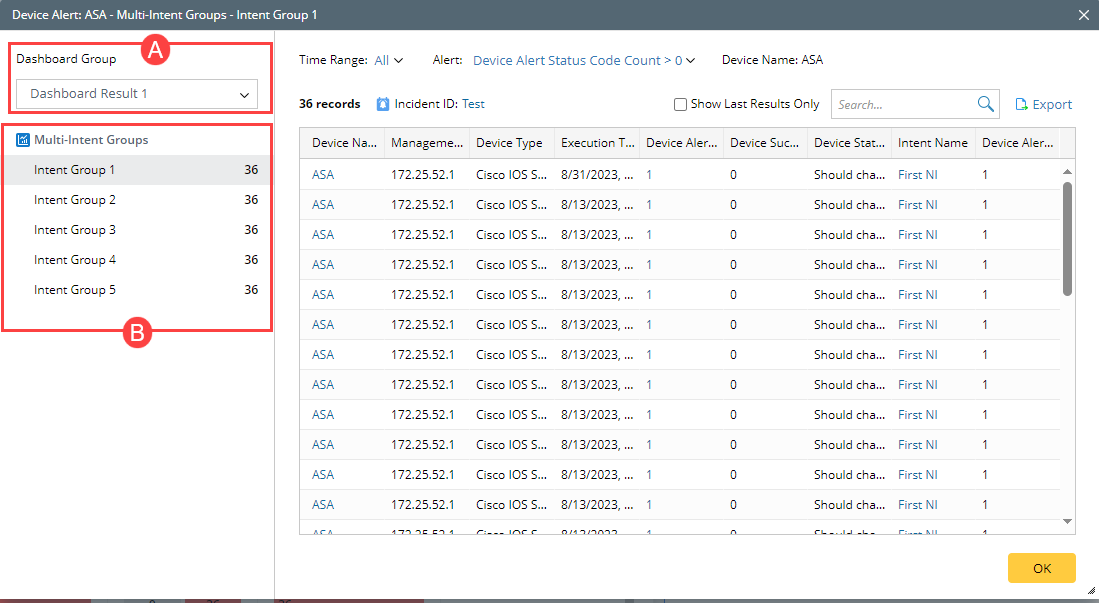
The device result report will be opened.
A. User can use this drop-down menu to switch to a different dashboard group.
B. Switch drill-down reports by intent group. Only the intent group with alerts will be listed.
Tip:
If the chart data is set to display historical data, but users only want to see the last results in this drill-down report, they can check the Show Last Results Only option.
If chart data is set to display last results, this option will not be available as the report will only display the last results.
Result Detail Chart
Users can decide which kind(s) of results they would like to see in the Result Detail Chart.
View Intent Results
Users can choose to display only intent-level diagnosis results for the result detail chart.
-
View and understand the chart:
| # | Name | Meaning | Note |
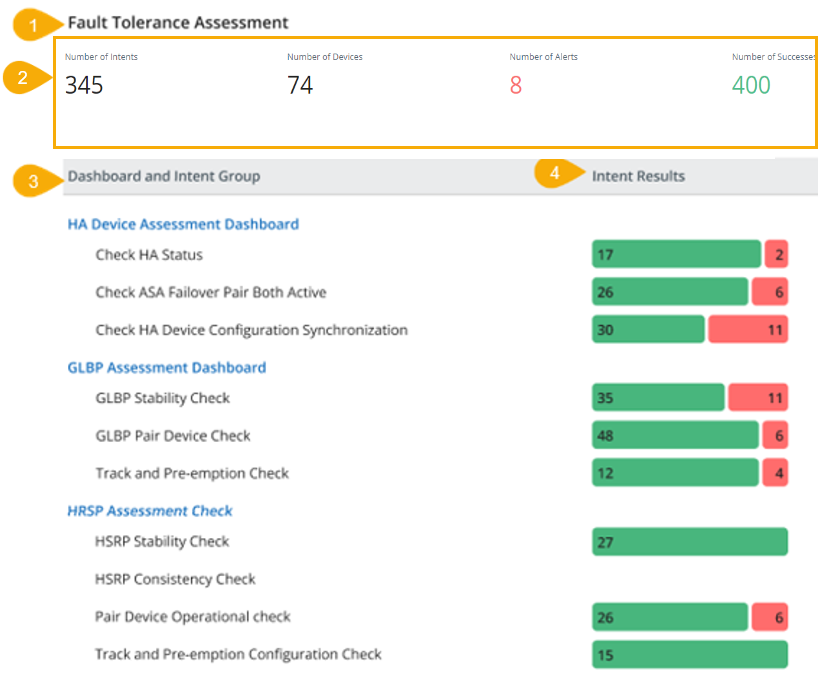
| 1 | Fault Tolerance Assessment | The chart title |
The chart title is defined in the settings.
|
| 2 | Number of Intents |
The total number of intents in the chart. The repeated intents will be excluded from the total number. |
They are parts of chart summary info and can be set to shown or hidden in edit mode.
|
|
Number of Devices
|
The total number of devices in the chart. | ||
| Number of Alerts |
The total number of the Intent Alert Status Code Count in the chart. The repeated alerts will be included in the total number. |
||
| Number of Successes |
The total number of the Intent Success Status Code Count in the chart. The repeated successes will be included in the total number. |
||
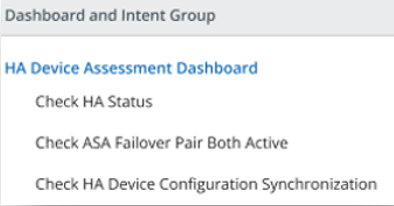
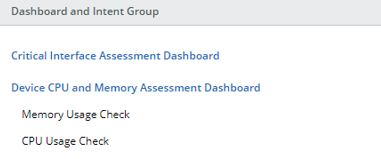
| 3 | Dashboard and Intent Group |
Display the dashboards selected for the chart along with their intent group names. Example:
|
If a dashboard only contains one intent group, the intent group name will not be displayed. Example:
Critical Interface Assessment Dashboard only has one intent group, so its intent group is hidden.
|
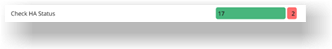
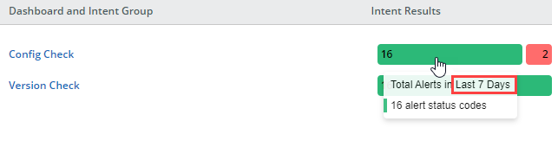
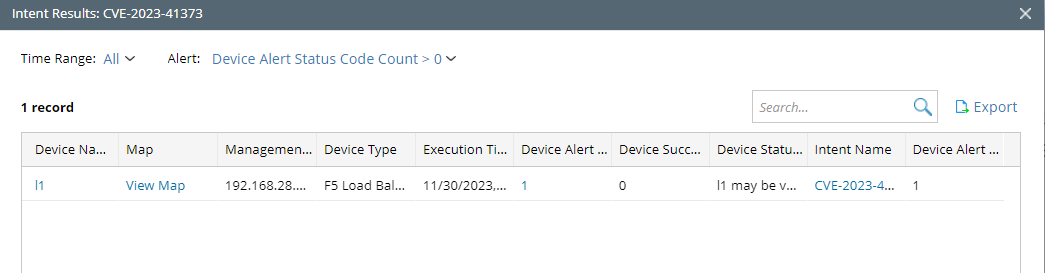
| 4 | Intent Results |
The bar chart visualizing the number/ratio of alert status code count and success status code count.
Hover over a bar, users can see the details for this number, such as result time range, result type, etc.
|
|
The numbers will be recalculated when the observability dashboard is refreshed/reopened.
-
Open Intent Dashboard and Drill-down Report.
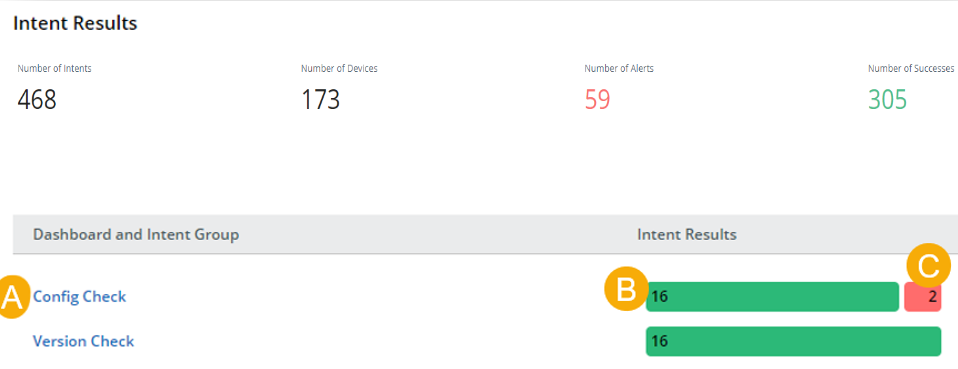
- To open the Config Check dashboard, click Config Check.
-
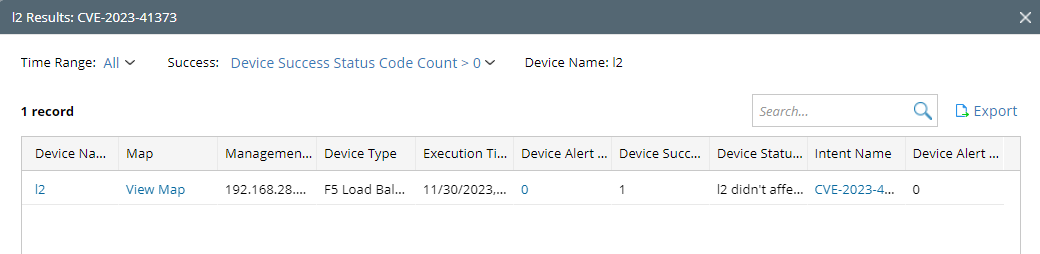
To open the report and view successful results, click the green bar.
-
To open the report and view results with alerts, click the red bar.
|
|
Tip: If the chart data is set to display historical data, but users only want to see the last results in this drill-down report, they can check the Show Last Results Only option.
If chart data is set to display the last results, this option will not be available as the report will only display the last results.
|
View Device Results
Users can choose to display only device-level diagnosis results for the result detail chart.
-
View and understand the chart.
| # | Name | Meaning | Note |
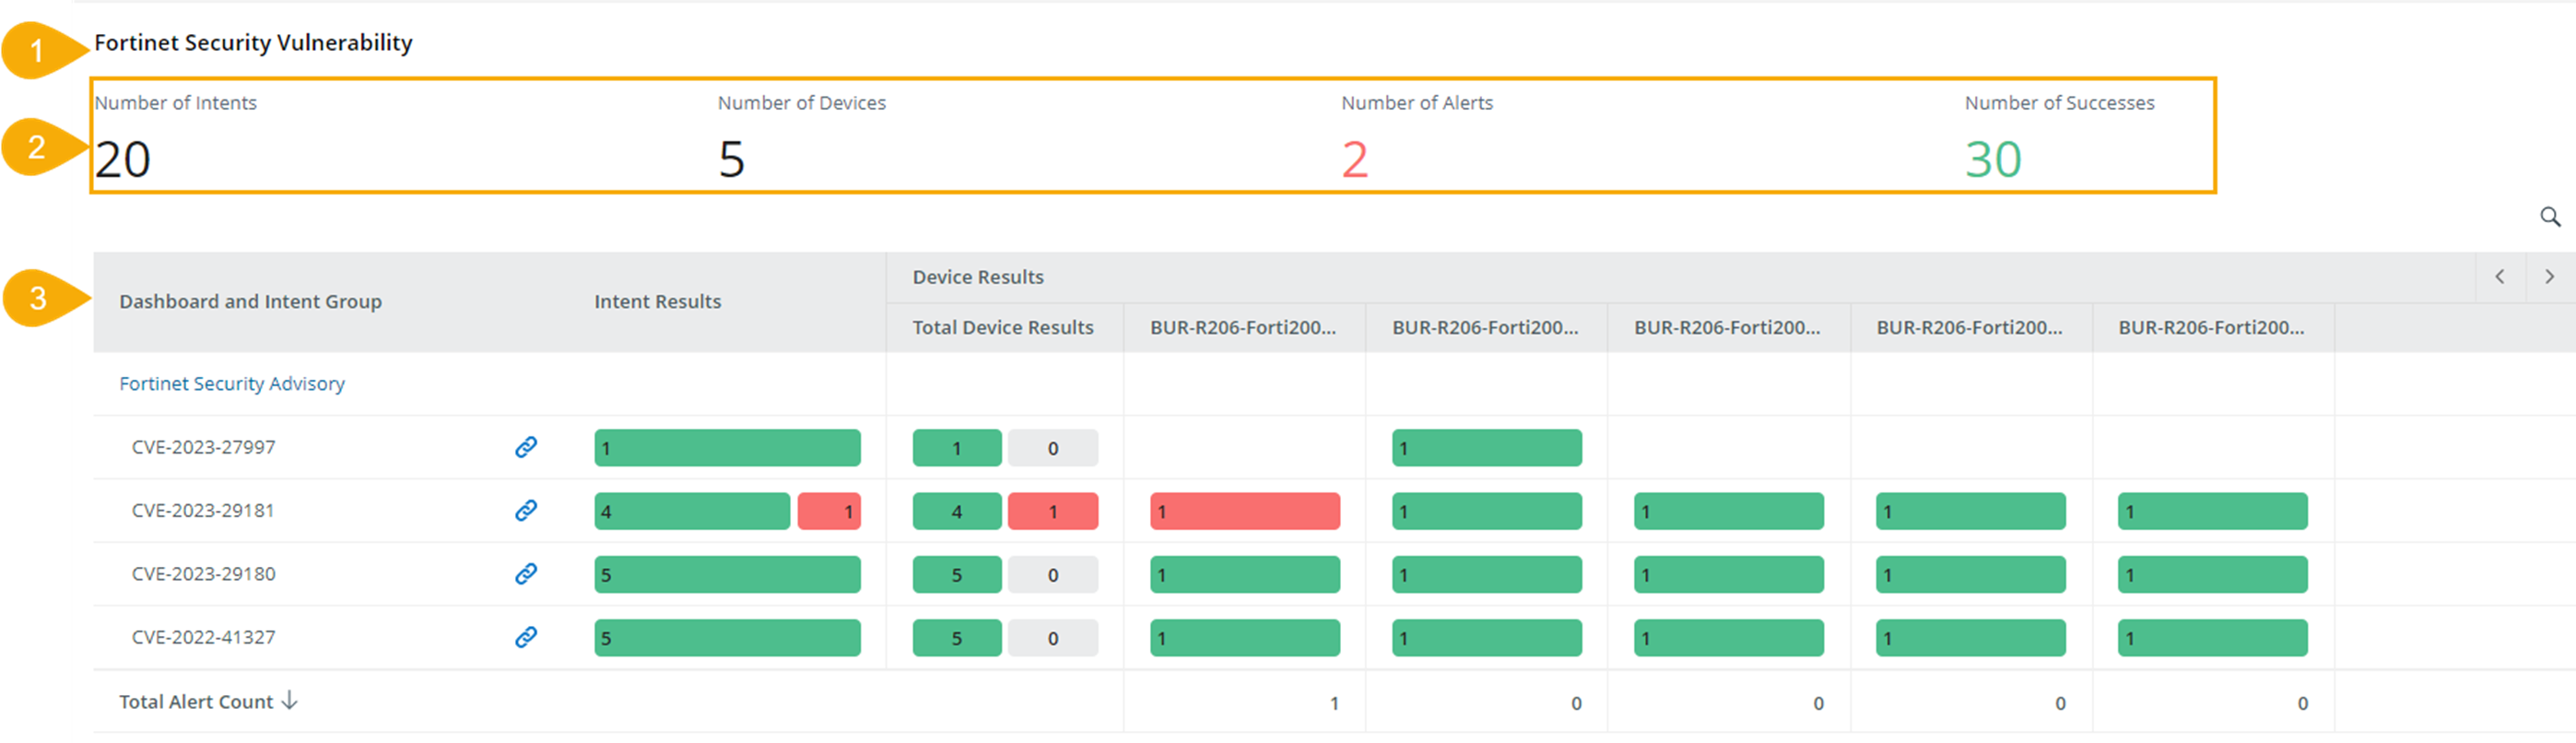
| 1 | Fortinet Security Vulnerability | The chart title |
The chart title is defined in the settings.
|
|
2 |
Number of Intents.
|
The total number of intents in the chart.
|
|
| Number of Devices |
The total number of intent devices in the chart.
|
They are parts of chart summary info and can be set to shown or hidden in edit mode.
|
|
| Number of Alerts |
The total number of the Device Alert Status Code Count in the chart. The repeated alerts will be included in the total number. |
||
| Number of Successes |
The total number of the Device Success Status Code Count in the chart. The repeated successes will be included in the total number. |
||
| 3 |
Dashboard and Intent Group
|
Display the dashboards selected for the chart. Display intent groups in each dashboard.
|
|
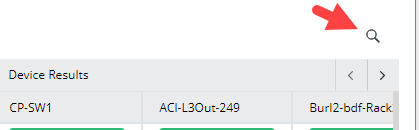
| Device Total |
|
||
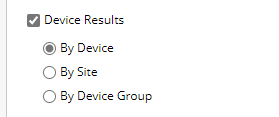
| Device Results/Device Results by Site/Device Results by Device Group |
|
|
|

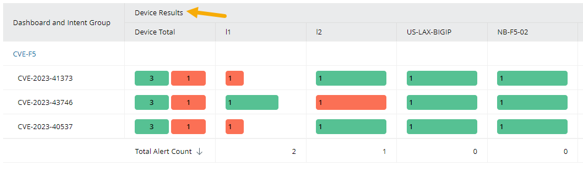


-
Open Intent Dashboard and Drill-down Report.
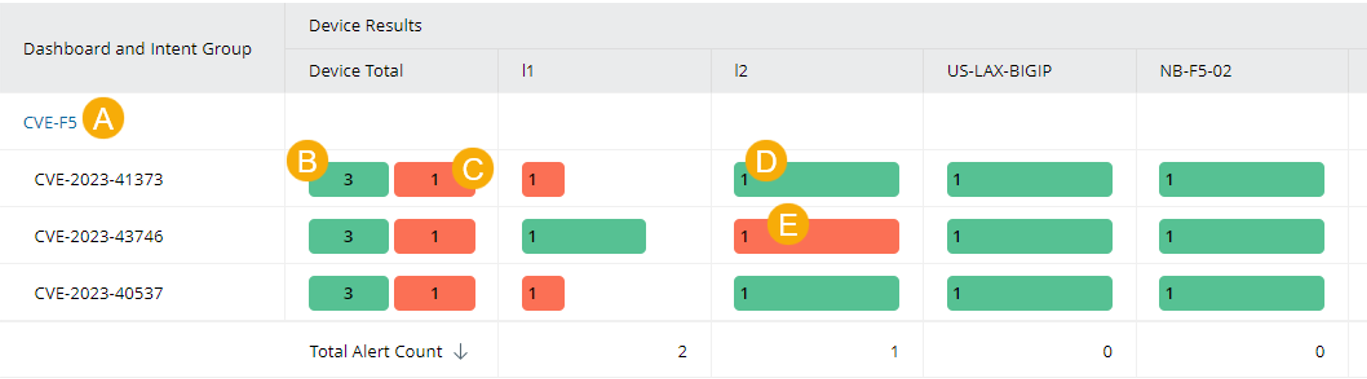
- To open the CVE-F5 dashboard, click CVE-F5.
-
Click a green bar in the total column to view the total number of success status codes on this intent group.
-
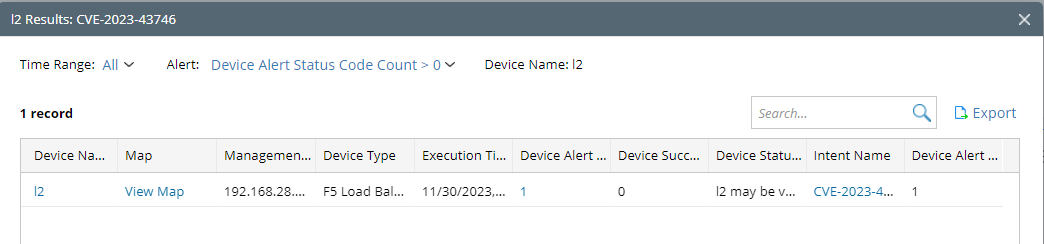
Click a red bar in the total column view the total number of alert status codes on this intent group.
-
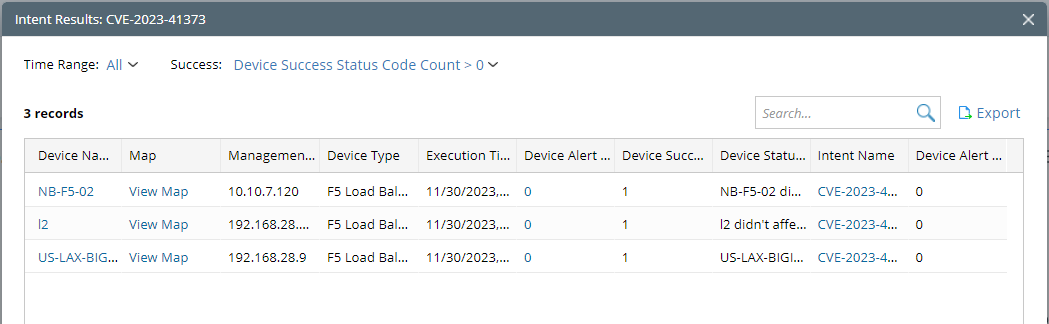
Click a green bar in the device column to view the success status code count for this device in the intent group.
-
Click a red bar in the device column to view the total alert status code count for this device in the intent group.
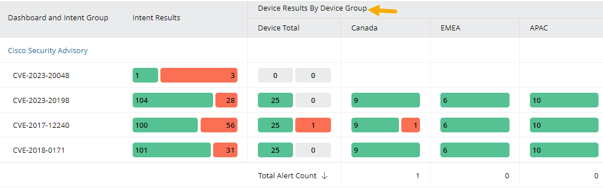
View Intent and Device Results
Users can choose to display both intent-level and device-level diagnosis results for the result detail chart.
View and understand the chart:

| # | Name | Meaning | Note |
| 1 | Cisco Security Vulnerability (Updated 1st Day in Every Month) | The chart title |
The chart title is defined in the settings.
|
| 2 | Number of Intents |
The total number of intents in the chart. The repeated intents will be excluded from the total number. |
They are parts of chart summary info and can be shown or hidden.
|
| Number of Devices |
The total number of intent devices in the chart. The repeated devices will be excluded from the total number. |
||
| Number of Alerts |
The total number of the Alert Status Code Count in the chart. The repeated alerts will be included in the total number. |
||
| Number of Successes |
The total number of the Success Status Code Count in the chart. The repeated successes will be included in the total number. |
||
| 3 | Dashboard and Intent Group |
Display the dashboards selected for the chart. Display intent groups in each dashboard. |
|
| Intent Results |
Refer to View Intent Results to understand the results. For drill-down reports, refer to the Open intent dashboard and drill-down report. |
||
| Device Results |
Refer to View Device Results to understand the results. For drill-down reports, refer to the Open intent dashboard and drill-down report. |
Geo-Map Chart
You can view the geo-map chart and open the drill-down report.
- View the chart.
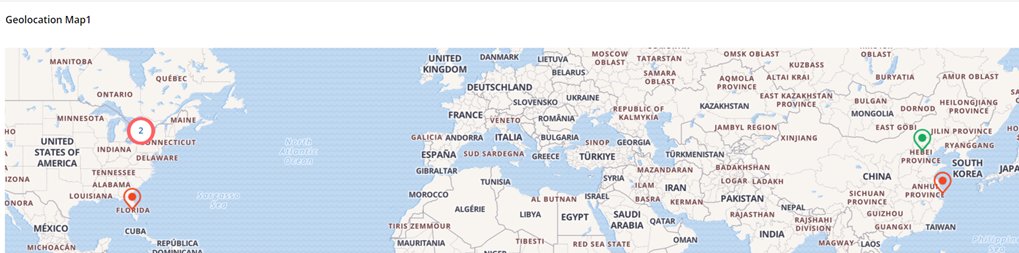
- Ping icon: Only one device is located at this address or configured with geolocation information.
- The icon in green: All devices have success status codes.
- The icon in red: All devices have alert status codes.
- Icon with green and red: some devices have alert status codes, while others have success status codes.
- Number in the circle icon: The total number of devices.
- Open the drill-down report by clicking the icon.

- You can switch between device hostnames.
- You can click the dashboard group listed on the left pane to see their drill-down report.

Tip: The dashboard groups are the ones selected as data scope for the Geo-location chart.
- You can switch between device hostnames.