R12.1-JA-2025June05
Create Observability Dashboard
You can create an observability dashboard in the Observability Dashboard.
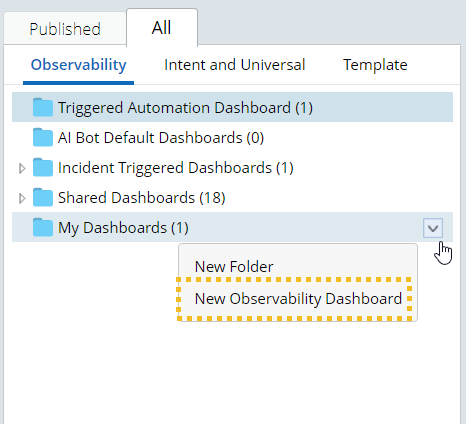
- Under the Observability tab, right-click the Shared Dashboards or My Dashboards.
- Select New Observability Dashboard from the drop-down menu to open a new tab for the observability dashboard in editing mode.
- Select the data scope based on the need:
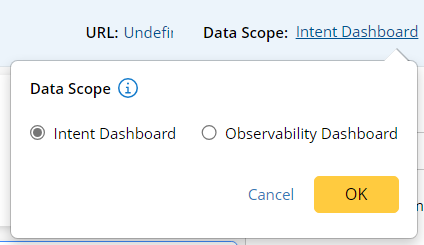
- Intent Dashboard: Create this observability dashboard with intent dashboards.
- Observability Dashboard: Create this observability dashboard with other observability dashboards.
- Enter the name, and description for the observability dashboard.
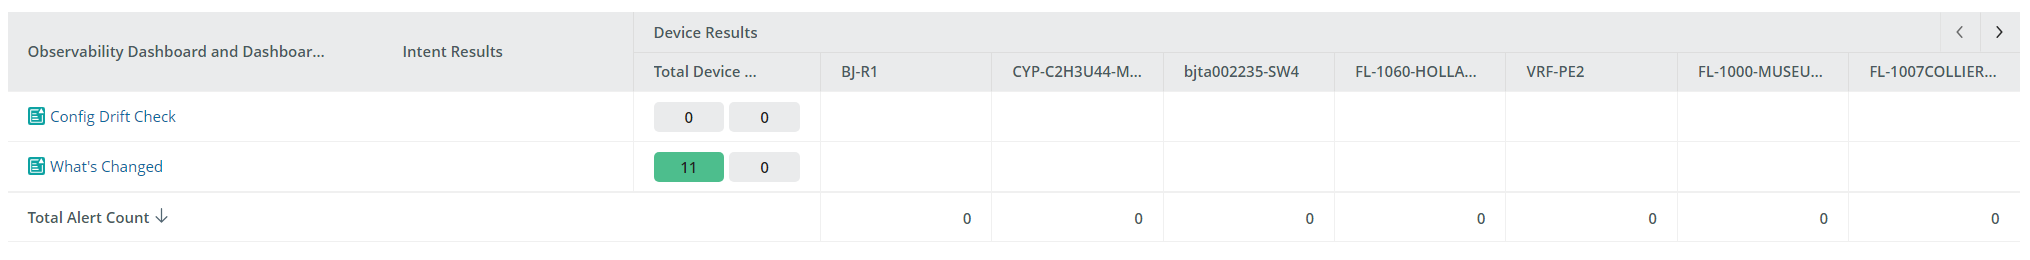
- In the editing mode, a summary chart and a Result Detail chart will be created automatically.
- The summary chart provides summarized information for all the dashboards in this observability dashboard and cannot be edited or deleted. You can edit the chart label by clicking it and entering the new name.

- A Result Detail chart displays the intent or/and device level status codes for selected dashboards, and you can define the chart content in the editing pane on the right. You can inline edit the chart label by clicking it and entering the new name.
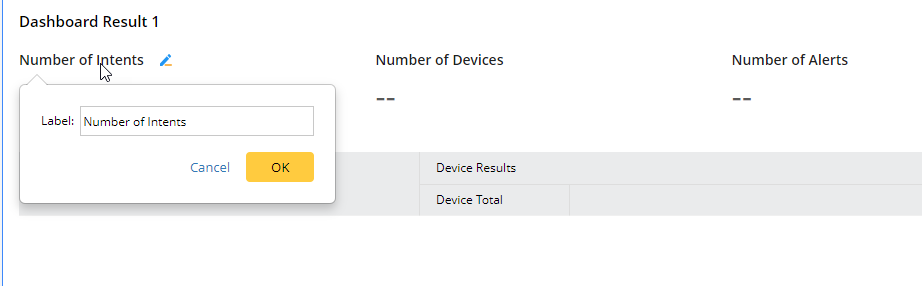
- The summary chart provides summarized information for all the dashboards in this observability dashboard and cannot be edited or deleted. You can edit the chart label by clicking it and entering the new name.
- Define the following settings for the result detail chart.
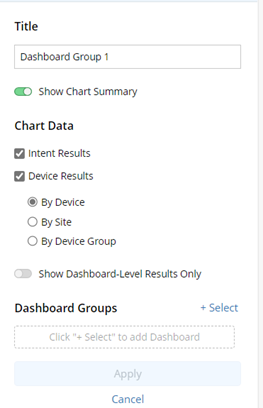
- Title – Defines the title of the chart.
- Show Chart Summary – summarizes the number of intents/devices, alerts, and successes for all dashboards in this chart. You can choose to show or hide it.
- Chart Data:
- Intent Results: Show intent results in the chart.
- Device Results: show device results in the chart.
- Select the way to display the data. You can choose to display the device status codes by device, by site, or by selected device groups.
- Show Dashboard-Level Results Only: Choose whether to hide the dashboard group results and only show dashboard-level results.
- For observability dashboards created with intent dashboards, enabling this setting only shows the intent dashboard results and hides the intent group results.
- For observability dashboards created with other observability dashboards. enabling this setting only shows the observability dashboard results and hides the dashboard group results.
- Dashboard – Select the dashboards(<=100) to be displayed in this chart.

- Click Apply to apply the settings to the result detail chart.
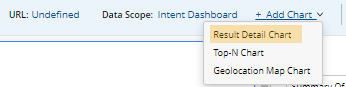
- You can add more charts by clicking the +Add Chart and adding more Result Detail Charts:
- Click Save to save the observability dashboard.
See also: