R12.1-JA-2025June05
Key Components and Basic User Flow
Key Components
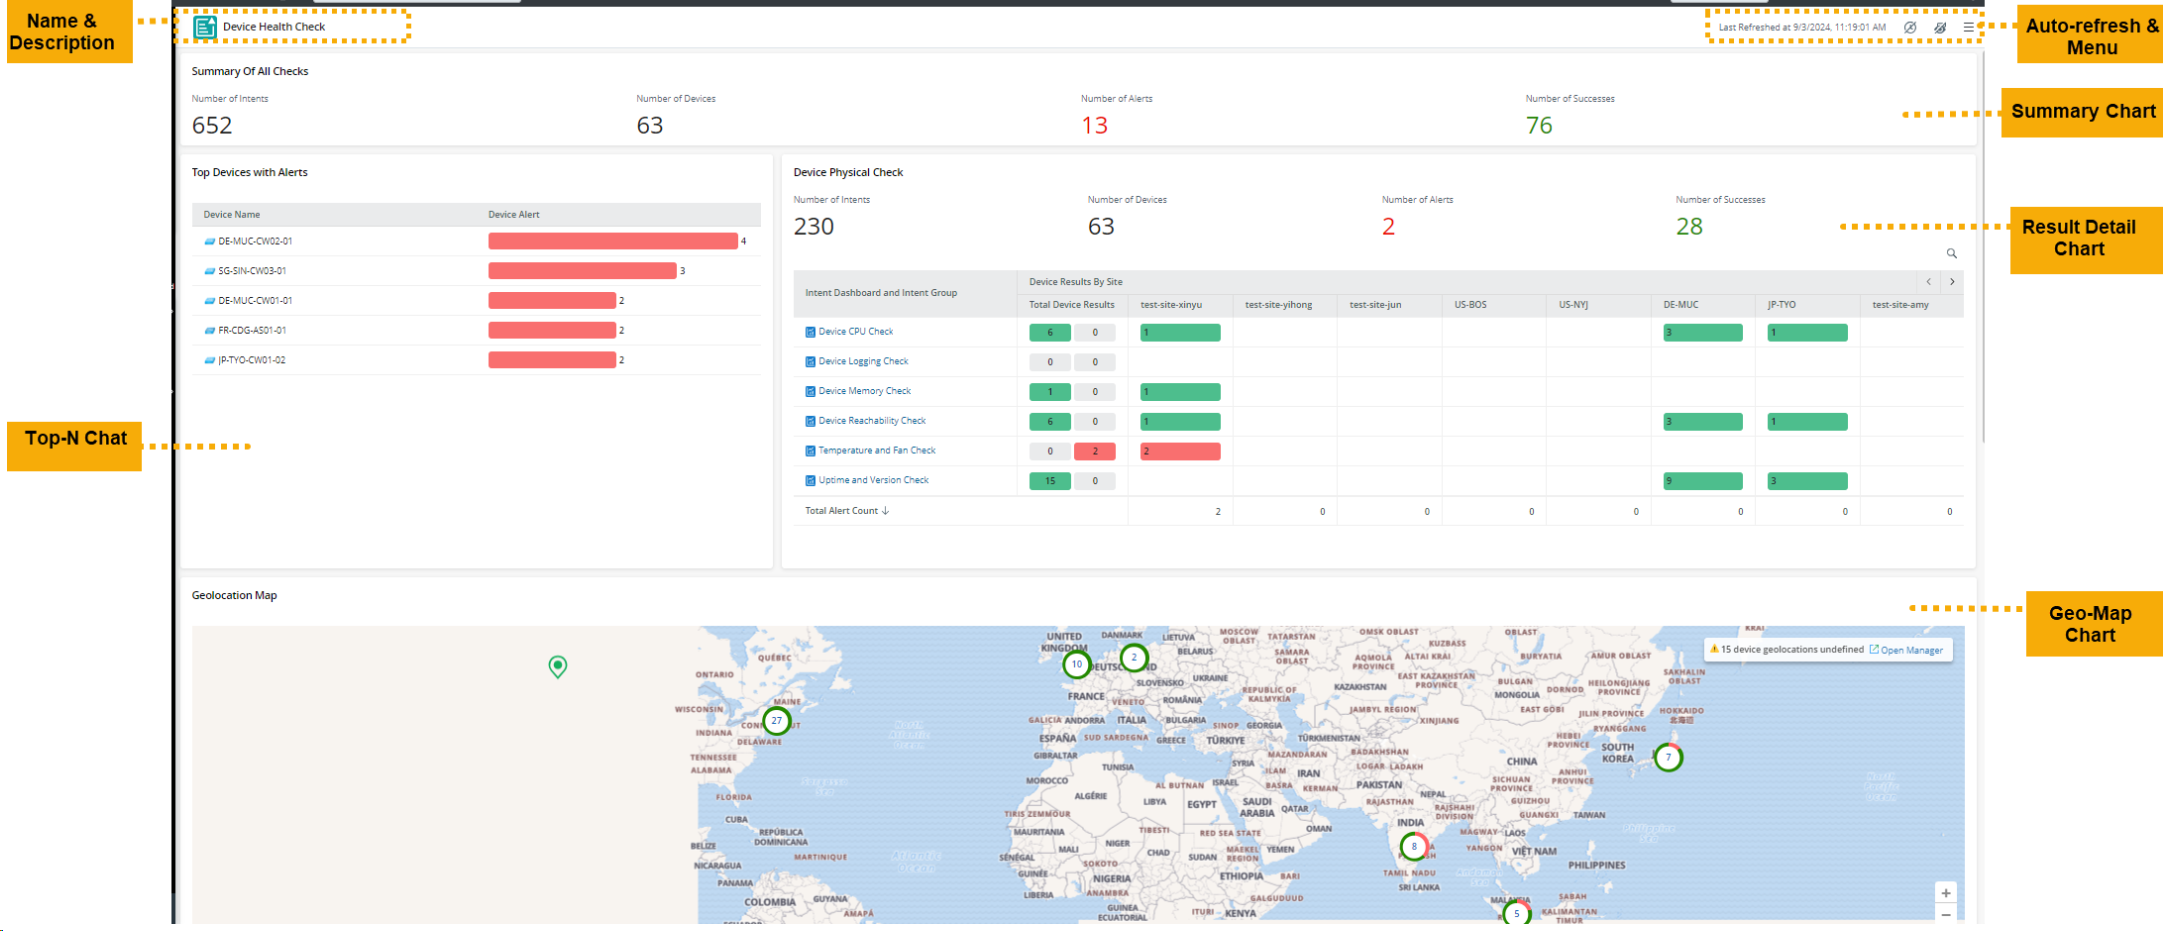
The view observability dashboard page consists of the following key components:
- Name and Description – It displays the name and description for this observability dashboard.
- Observability Chart – The summary chart displays on the top of the whole dashboard and summarizes the key metrics on this dashboard.
- Number of Intents: The total number of Intents in this observability dashboard, calculated based on the input settings in intent dashboards.
- Number of Devices: The total number of devices in this observability dashboard, calculated based on the input settings in intent dashboards.
- Total Alerts: The numerical sum of all alert status code counts on this observability dashboard.
- Total Successes: The numerical sum of all success status code counts on this observability dashboard.
- Top-N Chart – It lists the devices with most alerts in descending order for selected dashboard groups.
- Result Detail Chart – Result Detail chart displays detailed diagnosis results from various perspectives based on user settings.
- Intent Results: Displays the number of intent success and alert status code count for intent groups on selected dashboards.
- Device Results: Displays the number of device success and alert status code count for intent groups on selected dashboards. The chart further breaks down the device results by device, site, or device groups.
Geo-Map Chart – It helps visualize the geographic locations of devices.
- Auto-refresh – Users can define a frequency for the observability dashboard to automatically refresh.
Basic User Flow
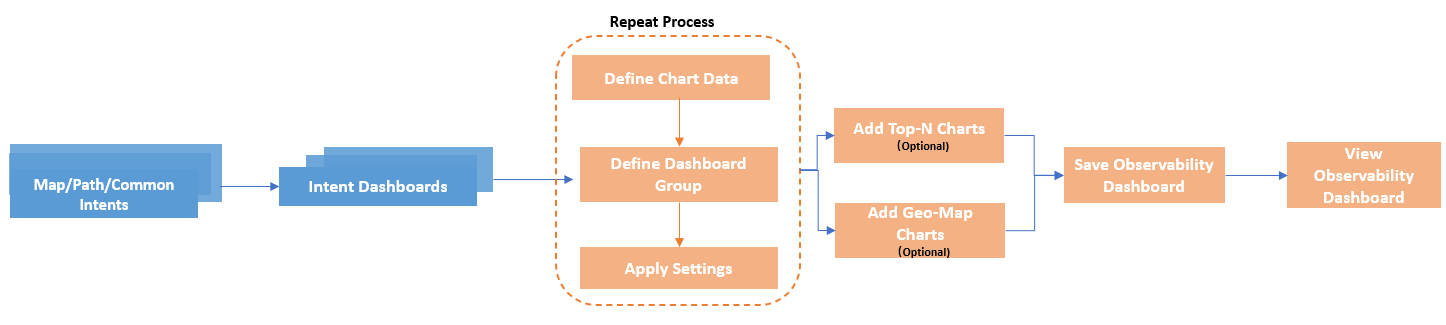
- Execute the Intents and display the results with Intent Dashboards.
-
Create an observability dashboard.
- Define the Chart Data for the result detail chart.
- Add the Intent Dashboards as a dashboard group to the result detail chart.
- Apply the settings to result detail chart.
- Repeat the step a, b and c to add more result detail charts.
- (Optional) Add Top-N Charts to highlight the devices with the most alerts.
- (Optional) Add Geo-Map Chart.
- View the observability dashboard.